
Unlock the secrets of advanced data visualization with Tableau and PowerBI after making the leap from Excel to Python!

Table of Contents
- Understand the Importance of Data Analytics Tools
- Choose the Right Tool for Your Needs
- Master the Basics of Data Engineering
- Document Your Data Lineage
- Establish Data Ownership
- Brush Up on SQL Skills
- Excel at Excel
- Get Comfortable with Python and R
- Visualize Data with Tableau and PowerBI
- Practice, Practice, Practice
- Conclusion
Welcome, teachers-turned-data-analysts! As you embark on your journey of mastering data analytics tools, you’re likely to encounter a plethora of options such as SQL, Excel, Python, R, Tableau, and PowerBI. In this blog post, we’ll focus on providing you with ten essential tips for mastering these tools to enhance your data visualization skills and make informed decisions based on data.
Understand the Importance of Data Analytics Tools
Before diving into the nitty-gritty of different data analytics tools, it’s crucial to understand the overarching importance of utilizing these tools in your professional career. Data analytics tools help you transform raw data into meaningful insights, empowering you to make data-driven decisions that can drive positive outcomes in your work.
Choose the Right Tool for Your Needs
When it comes to selecting the right data analytics tool for your needs, it’s essential to consider factors such as ease of use, scalability, and compatibility with your existing data infrastructure. SQL, Excel, Python, R, Tableau, and PowerBI are all powerful tools, each with its unique strengths and applications.
Master the Basics of Data Engineering
Understanding the fundamentals of data engineering is crucial for maintaining and processing large datasets efficiently. Data engineering involves handling data storage, retrieval, and processing, ensuring that your data remains accurate and accessible throughout its life cycle.

Image courtesy of www.linkedin.com via Google Images
Document Your Data Lineage
Tracking data lineage is essential for maintaining data quality and integrity within your organization. By documenting where your data comes from, how it has been transformed, and where it’s stored, you can ensure transparency and accountability in your data processes.
Establish Data Ownership
Assigning data ownership and responsibilities within your organization is key to ensuring that data is treated as a valuable asset. Data ownership helps clarify who is accountable for data quality, security, and compliance, fostering a culture of data-driven decision-making.

Image courtesy of www.fiverr.com via Google Images
Brush Up on SQL Skills
SQL (Structured Query Language) is a powerful tool for querying and manipulating relational databases. Whether you’re extracting data, performing complex calculations, or optimizing database performance, mastering SQL skills is essential for efficient data analysis.
Excel at Excel
Excel is a commonly used tool for data analysis and visualization due to its versatility and familiarity. To excel at Excel, consider learning advanced features such as pivot tables, data validation, and macros to streamline your data analysis processes and create insightful visualizations.
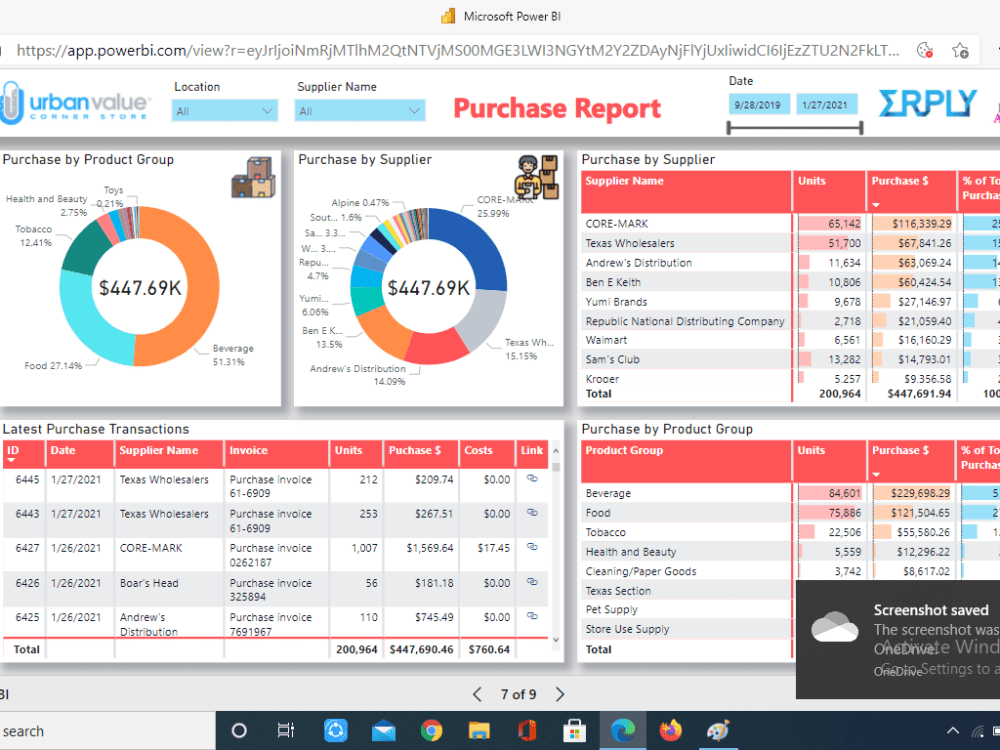
Image courtesy of www.upwork.com · In stock via Google Images
Get Comfortable with Python and R
Python and R are popular programming languages for data analysis, offering extensive libraries and tools for statistical analysis, machine learning, and data visualization. By familiarizing yourself with Python and R, you can take your data analysis skills to the next level and tackle complex analytical challenges.
Visualize Data with Tableau and PowerBI
Tableau and PowerBI are leading data visualization tools that enable you to create interactive and engaging visuals to communicate insights effectively. Whether you prefer the drag-and-drop simplicity of Tableau or the robust capabilities of PowerBI, mastering these tools can enhance your data storytelling abilities.
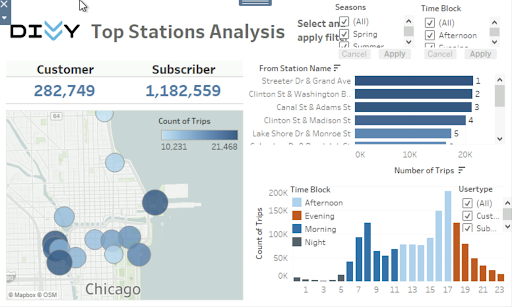
Image courtesy of www.datacamp.com via Google Images
Practice, Practice, Practice
As with any new skill, practice is key to mastering data analytics tools. Experiment with different tools, datasets, and analysis techniques to hone your skills and gain confidence in your data analysis capabilities. Continuous practice will not only solidify your understanding but also help you discover new ways to leverage data in your teaching profession.
Conclusion
Congratulations on taking the initiative to enhance your data analytics skills! By following these ten essential tips for mastering data analytics tools, you’re on your way to becoming a proficient data analyst with the ability to drive data-driven decisions and insights in your teaching career. Remember, practice makes perfect, so don’t hesitate to explore new tools and techniques to expand your data analysis capabilities further.
Keep analyzing, visualizing, and transforming data into meaningful insights – you’re on the path to becoming a data analytics rockstar!