
Discover how to seamlessly transition from SQL to Tableau with this comprehensive guide to mastering essential data analytics tools.

Table of Contents
How exciting is it to delve into the world of data analytics? As a teacher transitioning into a data analyst role, you’re about to embark on a journey filled with fascinating tools and technologies. In this comprehensive guide, we’ll take you through some of the fundamental aspects of data engineering and analytics, covering topics like data lineage, data ownership, SQL, Excel, Python, R, Tableau, and PowerBI. By the end of this blog post, you’ll have a solid understanding of these tools and be well-equipped to utilize them effectively in your new role.
Understanding Data Lineage
Let’s start by exploring the concept of data lineage. In the world of data analytics, data lineage refers to the life cycle of data, from its origin through to how it is used and analyzed. Understanding data lineage is crucial for ensuring data quality, traceability, and compliance. To effectively track and analyze data lineage, you can leverage various tools and technologies, such as data lineage tracking software and data visualization tools.
Data Ownership Best Practices
Establishing clear data ownership within an organization is essential for maintaining data integrity and security. As a teacher transitioning to a data analyst role, it’s important to understand the importance of data ownership and how to implement best practices. This includes defining roles and responsibilities, establishing data governance policies, and ensuring proper data access controls are in place.
Mastering SQL
Structured Query Language, commonly known as SQL, is the backbone of data analysis. SQL allows you to retrieve and manipulate data stored in relational databases. To master SQL, it’s essential to understand the basic syntax, learn advanced querying techniques, and optimize query performance. By honing your SQL skills, you’ll be able to extract valuable insights from your data efficiently and effectively.
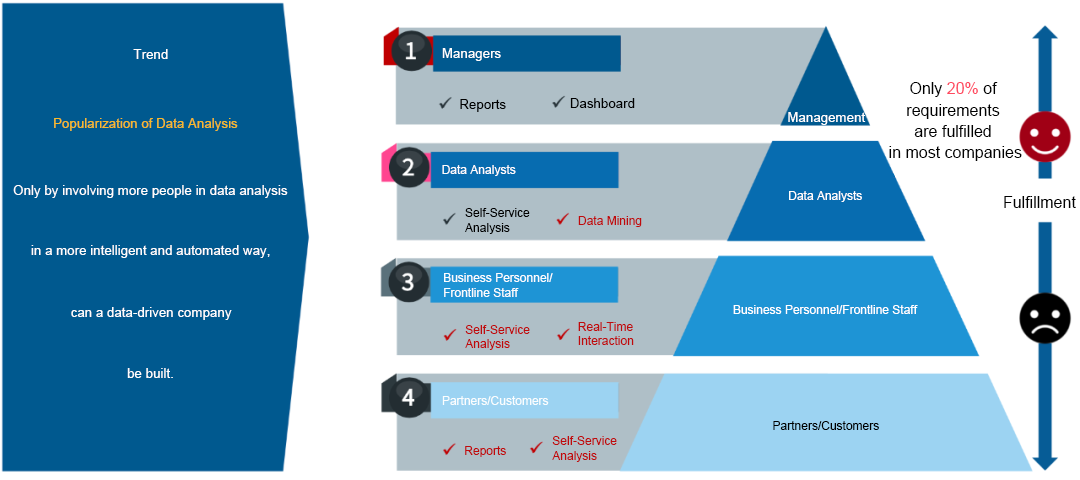
Image courtesy of kyligence.io via Google Images
Advanced Excel Techniques
Excel is a powerful tool for data analysis and visualization. To take your Excel skills to the next level, you can explore advanced features such as pivot tables, macros, and conditional formatting. By leveraging these tools, you’ll be able to analyze large datasets, create dynamic reports, and visualize data in a meaningful way.
Introduction to Python for Data Analysis
Python is a versatile programming language that is widely used in data analysis. With libraries like Pandas and Numpy, Python allows you to manipulate and analyze data efficiently. As you delve into the world of Python for data analysis, you’ll learn how to perform tasks like data cleaning, transformation, and statistical analysis. Python’s versatility and powerful capabilities make it an essential tool for any data analyst.
Image courtesy of data-flair.training via Google Images
Introduction to R for Statistical Analysis
R is another popular programming language used for statistical analysis and data visualization. With a rich ecosystem of packages and tools, R provides a robust platform for conducting advanced statistical analyses, predictive modeling, and data visualization. By mastering R, you’ll be able to uncover hidden patterns in your data and make data-driven decisions with confidence.
Data Visualization with Tableau
Tableau is a powerful data visualization tool that enables you to create interactive and engaging visualizations. With Tableau, you can explore your data, uncover insights, and tell compelling stories. By mastering Tableau, you’ll be able to create dynamic dashboards, interactive reports, and stunning visualizations that communicate complex data in a clear and meaningful way.

Image courtesy of www.linkedin.com via Google Images
Introduction to PowerBI for Business Intelligence
PowerBI is a powerful business intelligence tool that allows you to transform data into actionable insights. With PowerBI, you can create interactive reports, dashboards, and visualizations that enable you to make informed decisions. By delving into PowerBI, you’ll be able to extract meaningful insights from your data, drive business growth, and enhance your analytical capabilities.
Conclusion
Congratulations on taking the first step towards becoming a proficient data analyst! By familiarizing yourself with essential data engineering and analytics tools like SQL, Excel, Python, R, Tableau, and PowerBI, you’re well on your way to mastering the art of data analysis. Remember to continuously explore new tools, techniques, and technologies to further enhance your skills and stay ahead in the rapidly evolving world of data analytics. Happy analyzing!