
Unravel the secrets of data engineering success with these expert tips and strategies for maximizing your data potential today!

Table of Contents
Hey there, fellow teachers venturing into the exciting world of data analysis! Are you ready to dive into the realm of data engineering and discover the best practices and strategies for success? In this blog post, we’ll explore some valuable tips and techniques to help you master data analysis tools and elevate your data analysis skills to the next level. Let’s get started!
Choosing the Right Tool for the Job
When it comes to data analysis, having the right tool for the job is crucial. With a plethora of options available, such as SQL, Excel, Python, R, Tableau, and PowerBI, it’s essential to select the most suitable tool for your specific data analysis tasks. Consider the complexity of your data, the type of analysis you need to perform, and your familiarity with the tool to make an informed decision.
Understanding Data Lineage
Data lineage refers to the journey of data from its origin to its current state. Tracing data lineage is vital for understanding the flow of data within your organization and ensuring the accuracy and integrity of your analysis results. By mapping out data lineage, you can identify potential data quality issues and ensure that your analysis is built on reliable and trustworthy data.
Data Ownership and Governance
Establishing clear data ownership and governance practices is essential for effective data analysis. Data ownership defines who is responsible for the accuracy, security, and integrity of the data, while data governance sets the guidelines and processes for managing and using data within an organization. By defining clear roles and responsibilities, you can promote accountability and ensure that data is used appropriately in your analysis.
Image courtesy of www.linkedin.com via Google Images
Building Strong Foundations in SQL
Structured Query Language (SQL) is a powerful tool for querying and analyzing relational databases. To master SQL, it’s essential to understand the syntax and key concepts of the language. Start by learning basic SQL commands, such as SELECT, FROM, and WHERE, and gradually progress to more advanced topics like joins, subqueries, and indexing. Practice writing queries on sample datasets to improve your SQL skills and gain confidence in manipulating data.
Harnessing the Power of Excel
Microsoft Excel is a versatile tool that is widely used for data analysis and visualization. To leverage the power of Excel, familiarize yourself with its core functionalities, such as formulas, pivot tables, and charts. Explore advanced features like conditional formatting, data validation, and macros to enhance your data analysis capabilities. Excel’s user-friendly interface and extensive range of functions make it a valuable asset for teachers venturing into data analysis.

Image courtesy of www.linkedin.com via Google Images
Leveraging Python for Data Analysis
Python is a popular programming language for data analysis due to its simplicity and versatility. To harness the power of Python, start by learning the basics of Python programming and familiarize yourself with libraries such as pandas, NumPy, and Matplotlib. These libraries provide tools for data manipulation, analysis, and visualization, enabling you to perform complex tasks with ease. Dive into tutorials, online courses, and practice projects to build your proficiency in Python for data analysis.
Exploring Data Visualization with Tableau
Data visualization is a crucial aspect of data analysis, as it helps communicate insights and findings effectively. Tableau is a powerful tool for creating interactive and visually appealing data visualizations. To explore data visualization with Tableau, start by importing your data into Tableau and experimenting with different chart types and visualization techniques. Utilize features like filters, parameters, and dashboards to create dynamic and engaging visualizations that enhance your data analysis presentations.
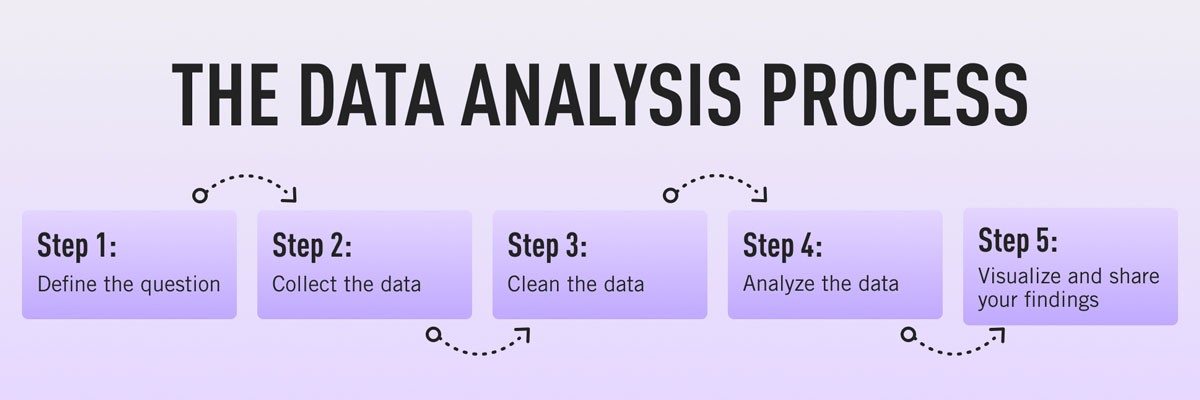
Image courtesy of www.linkedin.com via Google Images
Diving into Data Modeling with PowerBI
Data modeling plays a vital role in data analysis by organizing and structuring data for analysis and reporting. PowerBI is a popular tool for data modeling and creating interactive dashboards. To dive into data modeling with PowerBI, start by importing your data sources into PowerBI and defining relationships between tables. Utilize the Power Query Editor to transform and clean your data, and create calculated columns and measures to perform calculations and analysis. Experiment with different visualization types to build compelling data models that provide valuable insights for decision-making.
Conclusion
Congratulations on demystifying data engineering and advancing your data analysis skills! By incorporating these best practices and strategies into your data analysis workflow, you’ll be well-equipped to tackle challenging data analysis tasks with confidence and efficiency. Continue exploring new tools and techniques, and never stop learning and growing in your data analysis journey. Cheers to your success as a data-savvy teacher!