
Discover how to harness the power of Python for advanced data analysis and unlock the potential for deeper insights.

Table of Contents
- Understanding Data Engineering
- Importance of Data Lineage
- Establishing Data Ownership
- Mastering SQL for Data Analysis
- Advanced Functions in Excel
- Introduction to Python for Data Analysis
- Leveraging R for Statistical Analysis
- Exploring Data Visualization with Tableau
- Harnessing the Power of PowerBI
- Conclusion
Welcome, teachers embarking on the exciting journey of becoming data analysts! In today’s digitally driven world, the ability to gather, interpret, and present data is a crucial skill set for educators looking to make informed decisions and drive positive outcomes for their students. This blog post is dedicated to guiding you through the process of transitioning from basic data analysis tools like Excel to more advanced platforms like Python for deeper insights and enhanced data visualization.
Understanding Data Engineering
Before delving into the world of advanced data analysis tools, it’s essential to grasp the fundamentals of data engineering. Data engineering involves the design and creation of systems for collecting, storing, and analyzing data. By understanding data engineering principles, you can ensure that the data you work with is accurate, reliable, and well-organized, setting the foundation for successful analysis.
Importance of Data Lineage
One key concept in the realm of data analysis is data lineage, which refers to the history of data from its origin to its current state. Tracking data lineage is crucial for ensuring data quality and understanding the lineage of your data can help identify problems, monitor data flow, and maintain traceability for compliance purposes.
Establishing Data Ownership
As teachers turned data analysts, it’s important to establish clear ownership of the data you work with. By defining roles and responsibilities within your team or organization, you can ensure that data is used ethically and securely. Data ownership not only promotes accountability but also allows for more effective collaboration in data analysis projects.
Image courtesy of pegasusone-usa.medium.com via Google Images
Mastering SQL for Data Analysis
Structured Query Language (SQL) is a powerful tool for data manipulation and analysis. By mastering SQL, you can efficiently query databases to extract the information you need for analysis. From filtering and sorting data to performing complex joins and aggregations, SQL provides a robust framework for transforming raw data into actionable insights.
Advanced Functions in Excel
While Excel is a familiar tool for many teachers, it boasts a range of advanced functions that can enhance your data analysis capabilities. Functions like VLOOKUP, PivotTables, and conditional formatting can help you organize and analyze data more effectively. By harnessing the full potential of Excel’s advanced features, you can elevate your data analysis skills to the next level.

Image courtesy of www.linkedin.com via Google Images
Introduction to Python for Data Analysis
Python has emerged as a popular programming language for data analysis due to its versatility and ease of use. With libraries like pandas and NumPy, Python enables teachers to perform advanced data manipulation, cleansing, and visualization. By learning Python for data analysis, you can unlock a wealth of tools and resources to deepen your understanding and insights from data.
Leveraging R for Statistical Analysis
Another valuable programming language for statistical analysis is R. With its extensive range of packages for data manipulation and visualization, R provides teachers with a robust platform for conducting in-depth statistical analysis. By exploring R’s capabilities, you can enhance your ability to uncover patterns, trends, and relationships within your data.

Image courtesy of thedatascientist.com via Google Images
Exploring Data Visualization with Tableau
Data visualization is a powerful way to communicate insights effectively and engage stakeholders. Tableau is a popular tool for creating dynamic and interactive data visualizations that bring your findings to life. By mastering Tableau, teachers can create compelling dashboards and reports that make complex data easy to understand and interpret.
Harnessing the Power of PowerBI
Microsoft PowerBI is another valuable platform for data visualization and analysis. With its user-friendly interface and powerful visualization tools, PowerBI allows teachers to transform raw data into compelling narratives that drive decision-making. By harnessing the power of PowerBI, educators can gain deeper insights into their data and communicate findings with clarity and impact.
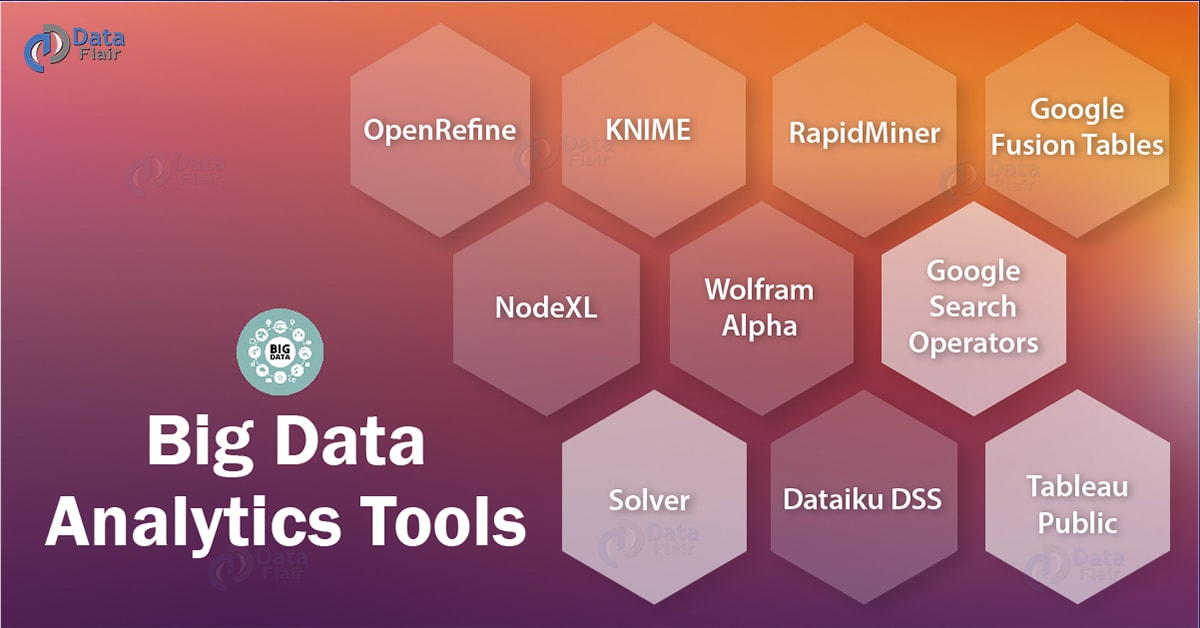
Image courtesy of data-flair.training via Google Images
Conclusion
Congratulations, teachers, on taking the first steps towards mastering advanced data analysis tools for greater insights and impact in your educational practice. By understanding the principles of data engineering, tracking data lineage, and establishing data ownership, you can lay a solid foundation for success in data analysis. Whether you’re diving into SQL queries, exploring advanced functions in Excel, or venturing into Python and R for deeper analysis, remember that the power of data lies in your hands. Embrace these tools, unleash your creativity, and transform data into actionable insights that drive positive outcomes for your students!