
Unleash the power of Excel with these expert tips and tricks to streamline your data analysis process effortlessly.

Table of Contents
Welcome, teachers who are eager to enhance your data skills and become proficient data analysts! Excel is a powerful tool that can simplify data analysis, reporting, and visualization. In this blog post, we will provide you with essential tips and tricks to help you master Excel and make data analysis a breeze!
Excel is a widely used software application for dealing with data in tabular form. Whether you are organizing student grades, tracking attendance, or analyzing survey results, Excel can help you manage and visualize your data efficiently. By mastering Excel, you can enhance your data analysis capabilities and make informed decisions based on data insights.
Tips for Improving Excel Skills
1. Learn Keyboard Shortcuts: Keyboard shortcuts can significantly improve your efficiency while working in Excel. Familiarize yourself with commonly used shortcuts such as Ctrl+C (copy), Ctrl+V (paste), Ctrl+Z (undo), and Ctrl+S (save).
2. Use Formulas and Functions: Excel offers a wide range of formulas and functions to perform calculations and data manipulations. Learn how to use functions like SUM, AVERAGE, VLOOKUP, and IF to analyze your data effectively.
3. PivotTables for Data Analysis: PivotTables are a powerful feature in Excel that allows you to summarize and analyze large datasets. Learn how to create PivotTables to gain insights into your data and identify patterns or trends.
Advanced Excel Features
1. Conditional Formatting: Conditional formatting allows you to highlight specific data points based on predefined conditions. Use conditional formatting to identify outliers, trends, or anomalies in your data quickly.
2. Data Validation: Data validation helps you ensure that your data is accurate and consistent. Create drop-down lists, input restrictions, and error prompts to maintain data integrity in your spreadsheets.
3. Macros and VBA: Macros and Visual Basic for Applications (VBA) enable you to automate repetitive tasks in Excel. Learn how to record macros and write VBA code to streamline your data analysis processes.
Creating Data Visualizations in Excel
Excel offers various chart types and visualization tools to help you present your data effectively. Experiment with different chart styles such as bar graphs, pie charts, line graphs, and scatter plots to visualize your data insights.
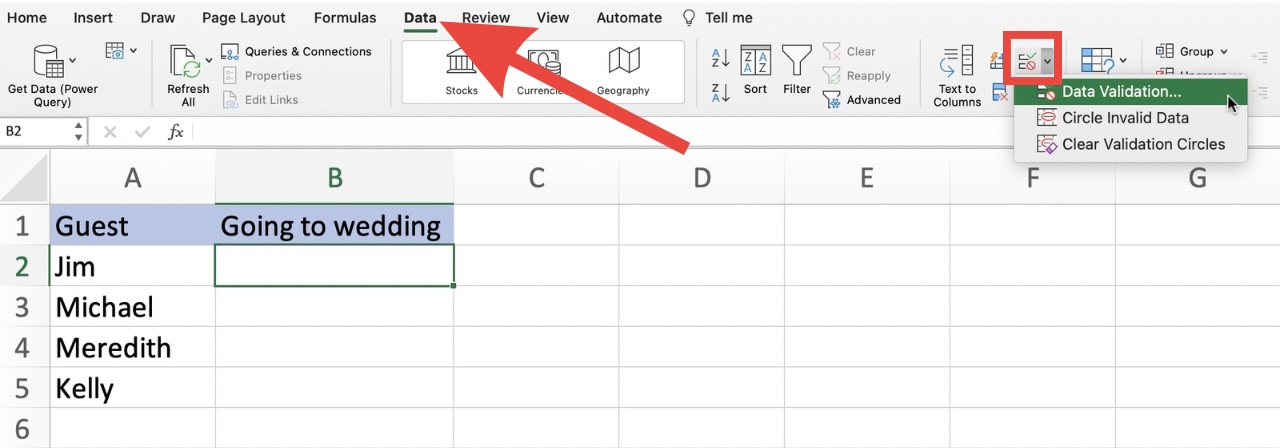
Image courtesy of www.myexcelonline.com via Google Images
Use Sparklines to provide a quick visual summary of trends in your data within a single cell. Sparklines are miniature charts that can be inserted next to your data to convey a clear picture of patterns or changes.
Explore Excel’s Power Query and Power Pivot features to connect and transform data from multiple sources and create interactive dashboards for dynamic data analysis.
Resources for Learning Excel
1. Online Courses: Platforms like Coursera, Udemy, and LinkedIn Learning offer online courses specifically tailored to Excel training for beginners to advanced users.
2. YouTube Tutorials: Search for Excel tutorials on YouTube to learn various tips, tricks, and advanced features. Many YouTubers create educational content on Excel for free.
3. Practice Exercises: Practice makes perfect! Work on sample datasets and challenges to apply your Excel skills and reinforce your learning experience.
Conclusion
By mastering Excel, teachers can streamline their data analysis processes, uncover valuable insights, and enhance decision-making based on data-driven evidence. Invest your time in learning and practicing Excel skills to become confident data analysts equipped with the tools to excel in data analysis tasks!