
Unleash the secrets of data analysis with Python – Learn how this powerful tool can transform your data game!

Table of Contents
Welcome, teachers! As educators looking to break into the realm of data analysis, you’re taking a step towards becoming data-savvy professionals in an increasingly data-driven world. In this blog post, we’ll delve into the power of Python and how mastering this programming language can help you excel in your data analysis endeavors. Let’s explore the ways in which Python can revolutionize the world of data analytics for teachers like you.
Understanding the Basics
Before diving deep into Python, it’s essential to grasp some foundational concepts in data analytics. Understanding data lineage, data ownership, and data engineering is crucial for building a strong analytical framework. Data lineage refers to the journey of data from its source through different processes and transformations. Data ownership involves establishing accountability for data within an organization, while data engineering focuses on the technical aspect of data processing and workflow. Familiarize yourself with these concepts to lay a solid groundwork for your data analysis journey.
Mastering SQL
SQL, or Structured Query Language, is a fundamental tool in data analysis. It allows you to query databases to extract and manipulate data efficiently. To hone your SQL skills, consider practicing on real-world datasets to gain hands-on experience. Online courses and tutorials can also provide structured learning paths to enhance your SQL proficiency.
Excel Mastery
Excel remains a versatile tool for data manipulation and analysis. Mastering advanced functions in Excel can streamline your data processing tasks and facilitate effective visualization. Dive deep into functions like VLOOKUP, PivotTables, and conditional formatting to unlock the full potential of Excel as a data analysis tool.
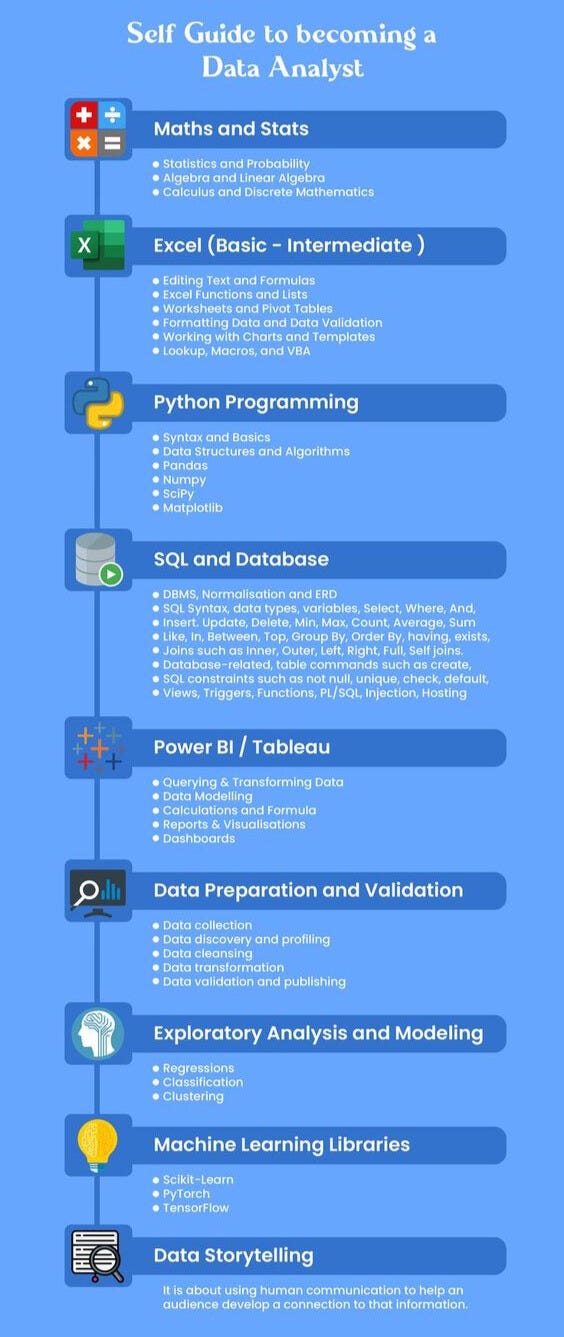
Image courtesy of medium.com via Google Images
Getting Comfortable with Python
Python’s simplicity and versatility make it a popular choice for data analysis tasks. Strengthen your Python skills by exploring libraries like Pandas, NumPy, and Matplotlib for data manipulation, numerical computing, and data visualization. Dedicate time to practicing Python coding exercises and projects to build proficiency in this powerful programming language.
Diving into R Programming
R is another prominent language in the realm of data analysis, especially for statistical analysis and data visualization. Experiment with R’s vast array of packages like ggplot2 and dplyr to create expressive data visualizations and perform complex statistical modeling. Adding R to your repertoire can expand your analytical toolkit and elevate your data analysis capabilities.

Image courtesy of www.linkedin.com via Google Images
Exploring Tableau
Tableau offers a user-friendly interface for crafting impactful data visualizations. Leverage Tableau’s drag-and-drop features to create interactive dashboards and reports that communicate insights effectively. Gain proficiency in designing visually compelling charts and graphs to present your data in a visually engaging manner.
Harnessing PowerBI
Microsoft PowerBI is a powerhouse for data analysis and visualization. Its integration with various data sources and robust analytical capabilities make it a valuable tool for educators diving into data analytics. Harness the power of PowerBI to create dynamic reports, uncover patterns in data, and gain actionable insights to drive informed decisions.

Image courtesy of medium.com via Google Images
Learning Data Lineage
Tracking data lineage is crucial for ensuring data accuracy and integrity in your analysis. Understand the flow of data within your analytical pipelines, identify potential bottlenecks or discrepancies, and establish protocols to maintain data lineage transparency. By documenting and tracking your data lineage, you can enhance the credibility and reliability of your analysis.
Understanding Data Ownership
Establishing clear data ownership protocols is essential in data analytics projects. Define responsibilities and accountabilities for data management, access, and usage within your organization to ensure transparency and compliance. By clarifying data ownership rights and governance framework, you can mitigate data-related risks and foster a culture of data stewardship.
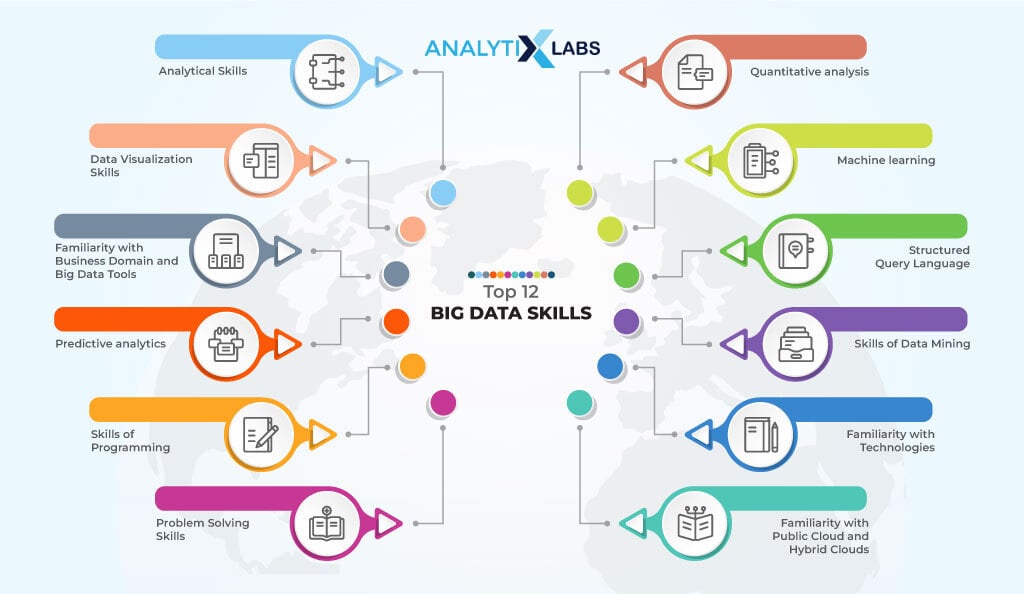
Image courtesy of www.analytixlabs.co.in via Google Images
Practice, Practice, Practice
The key to mastering data analytics skills lies in consistent practice and hands-on learning. Engage in data analysis projects, work on real-world datasets, and tackle challenging problems to sharpen your analytical skills. Continuously seek opportunities to apply your knowledge and refine your expertise in data analytics. Remember, practice makes progress!
Conclusion
Congratulations on embarking on your data analysis journey, teachers! By harnessing the power of Python and mastering a variety of analytical tools and concepts, you are equipping yourself with essential skills to excel in the field of data analytics. Keep exploring, experimenting, and learning to unlock new possibilities and make meaningful contributions in the data-driven landscape. With dedication and persistence, you can unleash the full potential of data analysis and make a significant impact in your educational endeavors.