
There’s a compelling journey that begins with raw data and culminates in powerful insights that can shape your decisions and strategies. In a world inundated with information, understanding this odyssey is crucial for you as a data-driven individual or business. This blog post will guide you through the intricate processes of data analytics, illuminating how you can transform seemingly disorganized bits of information into meaningful narratives. Uncover the secrets behind effective data interpretation and discover how to maximize the value of your data in this informative exploration.
Data Collection
The success of data analytics hinges on the quality and relevance of the raw data that you gather. Understanding where this data originates is crucial, as it allows you to create a robust analytical framework. With a plethora of sources available, you can begin to identify what datasets might be most pertinent to your goals. Every piece of data tells a story, and recognizing these narratives starts with tapping into the right sources. Whether it’s from internal records, customer interactions, or third-party databases, each source contributes uniquely to your overall analysis.
Sources of Raw Data
Data is abundant and can be sourced from multiple avenues, each presenting its potential for insights. One significant wellspring of raw data comes from transactional records—these could be sales figures, e-commerce data, or customer service interactions. Every transaction generates a trail of information, encompassing not only the numbers but also the context surrounding the interactions. By examining these transactional data points, you can uncover not only patterns of behavior but also opportunities for operational enhancements or new growth strategies.
Another important source is social media and online platforms, where the conversations and content shared by users serve as a rich trove of data. In today’s digital landscape, individuals often express their opinions and preferences through posts, comments, and reviews. This unstructured data can be mined for sentiment analysis or trend spotting, enabling you to tap into the zeitgeist of your target audience. Understanding these social dynamics provides insights that transcend traditional metrics, shedding light on what your customers truly value.
Moreover, publicly available data—such as census information, industry reports, and market research—can complement your internal and social data sources. This external dataset allows you to benchmark your performance against industry standards while identifying wider market trends. By amalgamating these diverse sources, you develop a multi-dimensional view that enhances the accuracy and depth of your analytics. Ultimately, the richness of your insights will depend on leveraging various sources of raw data that intertwine to create a comprehensive analytical tapestry.
Data Ingestion Methods
With the sources clearly defined, the next step on your journey involves how to bring this raw data into your analytical systems. Data ingestion is the process of importing, transferring, and processing data for storage or analysis. This crucial step ensures that you can efficiently manage and utilize the data you have collected from various sources. Data ingestion methods can vary greatly—from batch processing that accumulates data over time to real-time streaming that continuously feeds your systems with the latest information. Selecting the right method depends on your specific objectives and operational needs.
A well-thought-out ingestion strategy can greatly impact the speed and efficiency with which you can derive insights from your data. Different ingestion methods might suit varied data types and retrieval requirements. For instance, if you are dealing with large volumes of historical data, batch ingestion might be your best bet, executing the transfer in intervals to optimize resource use. Conversely, if real-time decisions are integral to your business—like in financial trading or customer experience applications—you may lean towards a stream-based approach that allows for immediate analytics. The right combination of techniques ensures that you can maintain data integrity while also capitalizing on the insights that arise from it.
Data Preparation
While the allure of insights and answers is enticing, the journey of data analytics begins well before you can glean meaningful conclusions. It starts with data preparation, a crucial phase that lays the foundation for your analytical endeavors. This stage is where raw data must be carefully refined, cleaned, and structured, ensuring that the subsequent analyses are based on reliable information. Skipping this step can lead you down a path of misguided insights, so it’s vital to recognize its importance in the grand scheme of data storytelling.
Data Cleaning and Preprocessing
Preprocessing is the meticulous act of transforming raw data into a format that is suitable for analysis. It involves several tasks, the most critical of which is data cleaning. During this stage, you will identify inconsistencies, correct inaccuracies, and eliminate duplicates that may skew your findings. Imagine sifting through a pile of unorganized papers—your task is to sort through it all, ensuring that everything is accurate and reliable. Without a rigorous cleaning process, your data retains the potential for significant errors, which can propagate through to later stages of your analytical process, leading to erroneous conclusions.
Moreover, you might discover that your dataset contains missing values or outliers that could affect the integrity of your results. Addressing these anomalies is vital, whether it involves filling in gaps through statistical methods or removing those outliers altogether. Each choice you make during this process acts as a stepping stone towards deeper understanding. Just as a sculptor chisels away at a block of marble to reveal a masterpiece, you too will refine your data to reveal the insights hidden within.
Ultimately, the aim of data cleaning and preprocessing is not merely to handle issues but to create a robust dataset that will enhance your analytics. As you navigate this stage, remember that your efforts directly impact the reliability of your insights. Think of it as laying a strong foundation for a building; without it, everything you construct on top is inherently unstable, risking collapse at the slightest provocation.
Data Transformation and Feature Engineering
On the other hand, data transformation and feature engineering take center stage once the cleaning process is completed. This phase is where you refine and enhance your dataset by creating new variables or modifying existing ones to improve their analytical utility. Feature engineering asks you to think critically and creatively about the data at your disposal, allowing you to extract maximum value from it. It’s about finding the right angles and enhancing clarity, helping you see patterns and relationships that were previously hidden in the raw numbers.
This transformation can involve normalization, where data scales are adjusted, allowing for comparability across different measures. For instance, if you’re analyzing user engagement metrics, normalizing the data ensures that you can correctly interpret the impact of different user groups without numerical bias. Additionally, you might apply mathematical or logical functions to construct new features that capture the nuances of your dataset—imagine generating an engagement score using elements from various metrics that help paint a fuller picture of your user interactions.
As your features become more robust, they become critical to your analysis. You’ll not only improve the quality of your insights but enrich the engagement of your audience with the data narrative you construct. Out of the myriad ways you can refine your dataset, the relationship between your original data and the engineered features you create is paramount. This not only creates a closer connection to the answers you seek but also helps engage the curiosity of your audience, drawing them into a compelling data story.
Cleaning and transforming your data paves the way for insightful analysis, setting the stage for predictive modeling or visualization. These stages equip you with the tools necessary to communicate powerful narratives drawn from your dataset, steadily guiding you from raw data towards meaningful insights. This foundational work is analogous to a writer honing their draft—each iteration brings clarity, depth, and precision to your ultimate message.
Data Storage
Now that you’ve begun to understand the initial steps of data analytics, let’s research into a crucial component of the process: data storage. In the expansive realm of data analytics, the way data is stored can significantly influence how you will eventually decode it. Two primary frameworks have emerged to meet the diverse storage needs: data warehousing and data lakes. While they both aim to support effective data storage and retrieval, they cater to different requirements and types of data processing. Understanding their distinct characteristics will empower you to make informed decisions about how to manage your data assets.
Data Warehousing and Lakes
To illustrate the differences further, consider a data warehouse as a well-organized library, where every book is categorized and easily retrievable. A data warehouse is structured, meaning that data is stored in predefined schemas and typically involves the normalization of data for efficient querying and reporting. This structure makes it ideal for analytics that requires consistency, reliability, and performance—perfect for generating reports or insights from relational databases. By summarizing and aggregating data, a data warehouse allows you to execute sophisticated analytics with speed and precision. Thus, when you need a clear, consolidated view of your organization’s performance over time, a data warehouse serves as the reliable foundation upon which your analytical endeavors can thrive.
On the other hand, envision a data lake as a vast ocean, containing raw data in its native format, whether structured, semi-structured, or unstructured. A data lake accommodates vast amounts of diverse data, making it a favored choice for organizations that prioritize flexibility and agility in their analytics approach. Unlike data warehouses, which require data to fit into a specific format before being stored, data lakes allow you to store information as is, which can be useful for exploratory and advanced analytics, such as machine learning applications. You can define new schemas on-the-fly as you discover insights within your data. If your organization thrives on innovation and you seek to uncover patterns and trends, a data lake provides you with expansive possibilities.
In the final analysis, when deciding between a data warehouse and a data lake, you must consider the nature of your data and the types of analytics you wish to perform. Data warehouses offer structure and consistency, while data lakes provide the flexibility needed for handling raw data in various formats. Both play a pivotal role in the journey from raw data to actionable insights, and knowing where to position your data serves as a cornerstone in mastering your analytics strategy.
Database Management Systems
Database management systems (DBMS) are the silent engines that power your data storage solutions, serving as the intermediaries between users and their data. They allow you to create, retrieve, update, and administer databases through a systematic approach, providing imperative capabilities such as data integrity, security, and backup features. Depending on the specific needs of your organization, you might opt for a relational DBMS, which organizes data in tables and utilizes Structured Query Language (SQL) for data manipulation, or a NoSQL DBMS, which is more flexible and suited for unstructured data. By leveraging these systems, you can ensure that your data not only resides securely but also remains accessible and manageable as your analytics needs evolve.
Database systems equip you with the tools necessary to effectively handle large volumes of data. In the world of analytics, the smooth operation of these systems becomes crucial as they enable quick data retrieval and manipulation. Features such as indexing, querying, and transaction management all contribute to the agile handling of information. You might find yourself exploring into complex queries to extract specific insights or running batch processes to analyze trends within your data over time. With a robust DBMS in place, you can automate many tasks, allowing you to focus on deriving insights rather than getting bogged down by data management concerns.
It is vital to recognize that choosing the right database management system aligns with your data strategy. A strong DBMS can greatly enhance your ability to transform raw data into valuable insights efficiently. Just as a well-structured warehouse optimizes storage and retrieval, a competent DBMS streamlines data operations, ensuring your data is not just stored but also primed for intelligent analytics. Embracing this aspect of data management will position you better for analytical success as you move forward on your journey through data analytics.
Data Processing
Many people often underestimate the importance of data processing in the journey from raw data to actionable insights. In this complex world of data analytics, every piece of information must be meticulously handled to ensure accuracy and relevance. Without effective data processing, the raw data collected can easily turn into noise rather than the valuable symphony of insights you seek. At this stage of your journey, two crucial methods of handling data come into play—batch processing and streaming. Each technique has its own unique advantages and challenges, thus understanding their principles can significantly impact how you derive insights from your data.
Batch Processing and Streaming
To fully appreciate the contrast between batch processing and streaming, you must first recognize that each serves different needs based on how frequently you require updates. Batch processing involves collecting large volumes of data over a specific period and processing them as a single batch at predetermined intervals. Think of it as a weekly inventory check where all data is evaluated at once. This method allows you to process substantial quantities of data efficiently and is particularly useful for tasks where immediacy is not critical. By employing batch processing, you can run complex algorithms, conduct deep analyses, and generate comprehensive reports, all while managing resources effectively.
To contrast that, streaming is all about real-time data processing. Imagine you’re watching live sports or a news broadcast; the information is continuously flowing, and you expect to receive updates as they happen. Streaming enables you to analyze data moments after it’s generated, allowing you to capture dynamic insights and act quickly. This is particularly useful in environments where conditions change rapidly, such as fraud detection in finance or monitoring social media sentiment. By embracing streaming, you allow yourself the agility to respond to trends and anomalies in real time, ensuring you remain at the forefront of decision-making.
To draw a clear conclusion, the choice between batch processing and streaming truly hinges on the specific requirements of your analytical tasks. For projects that demand depth and comprehensive evaluations, batch processing would be the logical route, providing clarity and extensive insights. Conversely, when timeliness holds significant value, streaming emerges as the necessary choice, allowing you to react promptly and potentially transforming the way you engage with your audience. The key takeaway here is that understanding your needs will help you leverage these techniques effectively, ultimately propelling your data analytics journey forward.
Distributed Computing and Parallel Processing
To enhance the efficiency of data processing, especially with large datasets, you might want to explore the concepts of distributed computing and parallel processing. These two methodologies are crucial in breaking down computational tasks across multiple systems, allowing for a more streamlined and faster data analysis process. When you distribute a workload across several interconnected computers, it significantly reduces the time taken to process massive datasets, which is particularly beneficial in the age of big data. Imagine having a vast library of information that you need to sift through; instead of one librarian tackling the entire stack, you have an entire team working simultaneously, each person focusing on different sections of the library.
To further illustrate, parallel processing involves executing several processes concurrently, allowing your systems to handle multiple tasks at once. This is like an orchestra, where each musician plays their own part simultaneously, contributing to a harmonious final performance. By harnessing parallel processing, you’re not waiting for one job to finish before starting another; instead, you’re able to maximize efficiency and cut down on processing time, which can be pivotal when dealing with real-time data and analytics.
Distributed computing complements this approach by allowing resources and tasks to be spread across various nodes in a network, rather than relying solely on a single machine’s capabilities. With distributed systems, you can scale effortlessly, adding resources as your data grows. This flexibility is vital in today’s fast-paced world where new data continuously floods in. With both distributed computing and parallel processing, you set yourself on a path marked by speed, efficiency, and responsiveness, truly elevating your data analytics game to new heights.
Distributed computing harnesses the power of interconnected systems, enabling you to tackle processing challenges that would be insurmountable using a single machine. Whether dealing with varying data sizes, unexpected spikes in volume, or the need for swift analytical results, distributed computing allows you to adapt and thrive. Your ability to leverage both parallel processing for speed and distributed computing for scalability is the key to unlocking deeper, more meaningful insights from your data, reflecting a sophisticated understanding of modern data analytics practices.
Data Analysis
Despite the overwhelming amount of raw data available today, the path to deriving meaningful insights begins with effective data analysis. It is at this critical junction that you transform numbers, text, and other types of raw data into a narrative that helps dictate strategic decisions. This transformative process can be understood better through various facets, with descriptive analytics presenting the initial layer of understanding. It serves as the foundational block from which you can progress to more complex and insightful analytics. As you research into descriptive analytics, you will find that it involves summarizing past data and providing a clear view of what has occurred. Think of it as a lens that not only clarifies but contextualizes – allowing you to comprehend trends, patterns, and anomalies that exist within your datasets. Understanding these elements is important for your organization to grasp its historical performance and progress over time.
Descriptive Analytics and Statistics
With descriptive analytics and statistics, you cultivate the ability to simplify data into digestible formats like reports, dashboards, and visualizations. These summaries often include metrics such as averages, medians, and modes, providing critical insights about overall trends. You can also assess frequency distributions and visualize data through graphs or charts that help in identifying outliers and significant patterns. Engaging with descriptive statistics allows you to create a clear picture of what has happened in your dataset, making it much easier to communicate findings to stakeholders. In a world rich with data, this clarity becomes a powerful asset for any organization striving to leverage analytics for success.
On top of summarizing your data, descriptive analytics also opens the door to exploratory data analysis (EDA), which encourages you to probe deeper into the information at hand. Take the time to analyze different segments and subgroups within your data, as this perspective can reveal crucial insights that might have otherwise gone unnoticed. You may discover variations between different demographic segments or perhaps identify distinct patterns that exist within specific time frames. By encouraging curiosity and promoting a culture of questioning, descriptive analytics empowers you to unearth gems of insight embedded within what might initially appear as mere noise. The answers you seek often lie hidden in the minutiae, waiting for someone like you to lift the veil and uncover them.
Inferential Analytics and Modeling
Analytics does not stop at merely looking back; it also extends into predicting future outcomes and testing hypotheses. Inferential analytics and modeling are key in making predictions based on data insights. This branch of analytics allows you to derive broader conclusions from a smaller sample, enabling you to apply the insights gained from your data to a larger population. You engage with complex statistical methods, such as hypothesis testing and regression analysis, to estimate relationships and forecast trends. By employing these techniques, you can better understand the variables at play within your dataset and strategize accordingly. The results of your inferential analyses then serve to inform and guide decision-making processes, equipping you with the ability to formulate timely and intelligent strategies.
What makes inferential analytics particularly exciting is its ability to explore causal relationships rather than just correlations. You might employ methods such as A/B testing to determine which strategies yield the best outcomes or use predictive models to foresee potential market trends. Ultimately, statistical inference requires careful interpretation, acknowledging that no prediction is ever set in stone. Your analysis serves as an informed guideline rather than an absolute answer, inviting you to navigate uncertainty with a calculated approach. With inferential analytics and modeling at your disposal, you equip yourself with a refined footprint to stride confidently into the unknown.
Statistics is a powerful ally in the journey from raw data to insights. It embraces the intricate knowledge and methodological rigor required to deepen your understanding of data analytics. Embracing these practices allows you to harmonize descriptive and inferential analytics, ensuring that your analytical toolbox is equipped for any challenge you may face on your path of discovery.
Data Visualization
All data analytics professionals understand that data visualization is a critical step in transforming raw data into meaningful insights. It provides a way to communicate complex information clearly and efficiently, allowing your audience to grasp the nuances of the data at a glance. Through graphical representations, you can bring your data to life, illustrating trends, comparisons, and relationships that might otherwise be overlooked in mere tabulated figures. This visual approach not only enhances the analysis but also engages stakeholders, making your findings more compelling and easier to digest.
Types of Visualizations and Charts
To understand the landscape of data visualization, you should familiarize yourself with various types of charts and graphs that can help convey your message effectively. Each type serves a different purpose, depending on what you want to illustrate with your data. Common visualizations include bar charts, line graphs, scatter plots, pie charts, and heatmaps, each offering unique advantages and insights based on the nature of the data you are presenting. The choice of visualization can significantly impact how your audience interprets the information, so it’s important to choose wisely.
| Visualization Type | Best Use Case |
|---|---|
| Bar Chart | To compare quantities across different categories. |
| Line Graph | To show trends over time. |
| Scatter Plot | To illustrate correlation between two variables. |
| Pie Chart | To represent parts of a whole. |
| Heatmap | To convey data density or frequency across two dimensions. |
- Select the right chart type based on your data and message.
- Use colors effectively to highlight critical data points.
- Ensure your visualizations are accessible to all audiences.
- Avoid cluttered visuals that can confuse the reader.
- Label axes clearly to enhance understanding.
The irony is that, although there is a vast array of visualization techniques available, many people gravitate towards these conventional options, often limiting their capabilities to convey stories hidden within their data. Indeed, the powerful capacity of visuals lies in your ability to leverage these tools in a manner that invites your audience to engage deeply with the content. When you successfully do so, your audience isn’t just passive recipients of information; they become active participants in your narrative, actively exploring and discovering the insights you wish to share.
Best Practices for Effective Visualization
Charts are not just pretty pictures; they are the bridge between raw data and audience understanding. When used thoughtfully, they can encapsulate the essence of your findings and make a lasting impact. To achieve effective visualization, every time you create a chart or graph, consider clarity, simplicity, and purpose. Ask yourself: What is the main message you wish to convey? Are you prioritizing important information over aesthetics? Your visuals should enhance comprehension rather than detract from it, ensuring that every element has a clear relevance to the audience’s overall understanding.
Another crucial aspect of best practices in data visualization is the concept of storytelling. Your visualizations should form a coherent narrative that guides your audience through the rationale behind your data. Just as a gripping novel delivers tension and resolution, your visualizations should articulate your findings in a manner that builds interest and insight simultaneously. By layers of meaning woven into your visuals, you create an environment where the data can resonate on multiple levels, prompting questions, discussions, and further exploration.
Pattern Identification
After you have gathered and processed your raw data, the next crucial step in your analytical journey is pattern identification. This stage allows you to sift through the noise to uncover meaningful insights that can drive decision-making. Within pattern identification, two key techniques come into play: anomaly detection and outlier analysis, as well as trend analysis and forecasting. Each of these methods serves a distinct purpose in helping you make sense of your data and derive actionable insights from it.
Anomaly Detection and Outlier Analysis
Outlier detection is the process of identifying data points that significantly deviate from the expected range of values within your dataset. These outliers can provide a wealth of information, as they often indicate anomalies such as fraudulent activities, equipment malfunctions, or unexpected shifts in customer behavior. As you explore your data, you must train your analytical eye to spot these irregularities, differentiating them from the norm. For instance, if you’re analyzing sales data and suddenly observe an inexplicably high spike in purchases on a single day, you may want to dig deeper into that anomaly to uncover its underlying cause.
When focusing on outlier analysis, you harness a combination of statistical techniques and visualizations to understand the significance of these irregular data points. Using methods like Z-scores, interquartile range, or clustering algorithms, you can categorize these outliers and determine whether they are a result of error, an actual change in behavior, or something else entirely. Engaging with visual tools such as scatter plots or box plots can be instrumental as you seek to illustrate and analyze these deviations in an intuitive way, helping you craft a narrative around their implications for your business or organization.
Through meticulously delving into anomaly detection and outlier analysis, you empower yourself to spot critical insights while simultaneously avoiding potentially costly mistakes. In data analytics, a single outlier can open the door to discovering unprecedented opportunities or highlight risks that require your immediate attention. By remaining vigilant in recognizing these anomalies, you transform raw data into predictive insights that inform your strategic decisions.
Trend Analysis and Forecasting
On the other hand, trend analysis and forecasting are vital components that allow you to anticipate future outcomes based on historical data patterns. Trend analysis involves assessing data points over a specified period to identify consistent movements or shifts, providing a roadmap of where your metrics are heading. This process encourages you to think critically about the broader implications of these trends, giving you a clearer vision of what lies ahead. By examining how variables correlate over time, you can uncover valuable insights into customer preferences, market conditions, or operational efficiencies that directly inform your business strategy.
Forecasting, often seen as a natural extension of trend analysis, allows you to project future conditions based on the trends you’ve identified. Whether through time series analysis, regression models, or machine learning techniques, you can create informed predictions that help you prepare for what’s next. For example, if your trend analysis shows a steady increase in online sales during the holiday season, your forecasting models can estimate the potential surge in demand. This not only helps in inventory management but also supports targeted marketing efforts aimed at capitalizing on seasonal spikes in consumer behavior.
Pattern recognition budgets valuable time and effort into the quest for actionable insights, as it allows you to comprehend the underlying dynamics within your data. Knowing that trends can ebb and flow based on numerous factors—be it economic shifts, societal changes, or technological advancements—the knowledge you gain from conducting trend analysis equips you with the confidence to pivot strategies, enhance operational efficiencies, and ultimately better serve your customers. As you venture into the realms of trend analysis and forecasting, remember that it’s not just about predicting the future; it’s about empowering your organization to strategically navigate through it with foresight and clarity.
Insight Generation
Unlike the common misconception that data analytics culminates simply in visualizations and reports, the true value of analytics lies in the profound insights that can be drawn from the data. One of the pivotal steps in this process is correlation and causality analysis. This is where you examine deeper into the relationship between variables, aiming to uncover patterns that can inform your decision-making. By examining correlation—imperatively a statistical measure of how two variables move in relation to each other—you can begin to identify trends that catch your attention. However, it’s crucial to understand that correlation does not imply causation. When you see two variables moving together, like an increase in ice cream sales during summer months alongside higher rates of swimming pool usage, it’s imperative that you don’t jump to conclusions without scrutinizing the potential underlying factors influencing those relationships.
With a careful approach to correlation and causality analysis, you can influence your organization’s strategy in remarkable ways. The key is to ask the right questions and use statistical methods to draw clearer lines of influence. For instance, a business might notice a correlation between their marketing spend and the increase in sales. This isn’t merely about noting the data alignment; it’s about probing deeper. Does one genuinely result in the other, or are there external factors at play, such as seasonality or trends in consumer behaviour? By employing advanced analytics methods such as regression analysis, you can start quantifying these relationships and making informed predictions. This transformative understanding not only enhances your analytical acumen but ultimately leads to more effective strategies and solutions.
Moreover, causality analysis is about connecting those dots, identifying the cause-and-effect relationships. For you, this could mean determining that revamping your customer service processes led not just to happier customers but also a measurable increase in long-term sales. By integrating both correlation and causality into your analytics toolkit, you are armed with a more holistic view of your data landscape, empowering you to make better decisions grounded in deeper insights.
Recommendation Systems and Predictive Modeling
On the frontier of insight generation, recommendation systems and predictive modeling are game-changers in the world of data analytics. These methodologies allow you to harness the power of extensive data sets and turn them into actionable insights that can personalize experiences for your audience. Imagine walking into a digital store where every product recommendation is tailored specifically for you, based on your previous interactions and preferences. This is precisely what recommendation systems achieve. By analyzing patterns in user behavior, such as past purchases, browsing history, or even time spent on particular items, these systems offer you insights into what might interest you next, thereby enhancing user satisfaction and driving conversion rates.
The predictiveness of predictive modeling is another critical aspect you should pay attention to. By employing algorithms to analyze historical data, predictive modeling allows you to make forecasts targeted at future outcomes. It’s not just about making guesses; it’s about creating a robust model that maps out a probable future scenario based on current and historical patterns. For you, this might mean identifying which customers are most likely to churn, enabling you to take proactive steps to retain them before it’s too late. Similarly, predictive modeling can help in understanding future sales trends, allowing for better inventory management and resource allocation.
For instance, in e-commerce, a robust recommendation system can identify customer behavior patterns—pointing out trends that may show which products are frequently bought together or likely to appeal to different demographics. Combining these insights with predictive modeling can lead to actionable strategies that optimize both marketing efforts and product offerings, ensuring you stay ahead of market demands while providing tailored customer experiences. By melding these powerful tools, you open doors to a data-driven future where insights continuously evolve, informing your strategies and decisions at every level.
Model Evaluation
For any data analyst or data scientist, understanding how to evaluate the performance of your model is crucial. This process allows you to ascertain how well your model is predicting outcomes based on the data it has been trained on. Model evaluation provides a feedback mechanism that can guide you in refining your approach and making informed decisions regarding the effectiveness of the model. More importantly, it illuminates the path to insights that can inform business strategies, operational efficiencies, and user experiences.
Metrics for Evaluating Model Performance
Metrics play a fundamental role in quantifying the performance of your model. They act as the benchmarks against which you gauge success or areas for improvement. Common metrics such as accuracy, precision, recall, and F1-score provide a multifaceted view of how well your model is doing its job. For instance, accuracy gives a straightforward representation of the percentage of correct predictions, but you might find that relying solely on it can be misleading, especially in cases of class imbalance. Hence, grasping the nuances of these metrics is important for unveiling the true performance of your model.
Moreover, metrics should not be viewed in isolation. When you consider various metrics together, you begin to appreciate the broader context of your model’s capability. For example, a high accuracy rate might be overshadowed by low precision or recall, which signals that your model is predicting one class exceptionally well while struggling with another. It is critical for you to balance these metrics against the specific needs and risks of your application—whether you’re working in healthcare, finance, or retail. Only then can you derive valuable insights and make data-driven decisions that align with your objectives.
Finally, assessing your model’s performance through the lens of metrics also unlocks opportunities for improvement and understanding of its limitations. You might need to implement strategies such as cross-validation to ensure that your performance metrics are not just a reflection of the specific train-test split you used, but that they generalize well to unseen data. In doing so, you create a robust foundation that strengthens your analytical capabilities and enhances the accuracy of your insights as you move through the data analytics journey.
Model Selection and Hyperparameter Tuning
Evaluating model selection and hyperparameter tuning is an intricate dance of finding the right balance between simplicity and complexity. As you navigate this phase, you must choose the model architecture that best aligns with your data type and the problem at hand. Whether it’s opting for a linear regression model for straightforward predictions or a more complex neural network for intricate patterns, your choice significantly impacts how well your model can learn from the data. Furthermore, the magical element of hyperparameter tuning comes into play—these parameters are not learned from the training process but require your critical intervention. You’ll adjust these knobs of learning rates, batch sizes, and depth of trees to finesse your model’s performance, ensuring that it captures the essence of the underlying data while avoiding underfitting or overfitting.
As you refine your model selection and research into hyperparameter tuning, you will find that this process is often iterative. The aim is to discover the optimal settings that yield the best performance while simultaneously considering computation costs and time. Techniques such as grid search and random search can become invaluable allies during this phase, guiding you to systematically explore various combinations and configurations. The delicate balance between exploration and exploitation is important here; you want to explore enough to find something better but also exploit what you already know is working.
A vital takeaway is that model selection and hyperparameter tuning are more than mere activities in a data analyst’s toolkit; they are an art form. As you launch on this journey, you will not only become adept in improving your models but also in honing your intuition about how different models behave under various conditions. The deeper your understanding, the more equipped you will be to craft models that not only perform well but also contribute to meaningful insights and decisions in your business arena.

Model Deployment
Not every model developed in the world of data analytics achieves its intended impact without a well-thought-out deployment strategy. It is not enough to simply have your models sitting in a repository, waiting for your users to stumble upon them. What you need is a robust framework for integrating these predictive models into your existing systems. This is where Model Integration and API Development come into play, providing the vital link that enables your models to be used effectively in real-world applications.
Model Integration and API Development
The first step in this journey is creating an application programming interface (API) that allows external systems to interact with your model seamlessly. You can think of APIs as the bridges that facilitate communication between your model and the various software components that rely on it. This means that your API must be designed not just for functionality, but also for scalability and security. After all, if your model is addressing a real business need, it will likely be called upon by numerous applications, making performance a crucial factor to consider as you develop it.
Once your API is established, the next step is the integration of your model into existing business processes. This often involves collaboration with engineers and software developers to ensure that the deployment is smooth and that the model operates in an environment that captures and processes data in real-time. This stage is often where the rubber meets the road—ensuring that the data your model needs is available, that the model can run efficiently, and that it can deliver actionable outputs in a format that your users can easily understand and utilize in decision-making.
Your focus shouldn’t stop once the model is integrated. Continuous user feedback during this period is invaluable. This iterative feedback loop allows you to make necessary adjustments, ensuring that your model is not only functioning correctly but also evolving alongside your business’s needs and objectives. Emphasizing this collaborative effort can lead to innovations that enhance the model’s utilization, underscoring the importance of a dynamic approach to model deployment.
Model Monitoring and Maintenance
Model performance doesn’t remain static after deployment. In fact, it often requires your constant attention. Model monitoring and maintenance are crucial steps that ensure your models continue to yield relevant insights as new data enters the system. With the complexity of real-world scenarios and the fluctuation of market trends, models can easily degrade in performance or drift from their original design. This is where the art of monitoring comes into play; you must establish metrics that signal when a model is underperforming and align them with your business objectives to guarantee that you catch these issues early.
Model performance monitoring involves a multitude of strategies, such as tracking error rates, monitoring predictions against actual outcomes, and analyzing the feedback loop with end-users. This multi-faceted approach allows you to identify not just when a model isn’t performing well, but also why it’s happening. By employing visualization tools, you can create dashboards that provide real-time insights into your model’s efficacy, enabling you to make informed decisions about when adjustments are necessary.
Maintenance is where proactive management comes into play. Regular assessments of your models will allow you to refine algorithms, retrain models with new data, and address any shifts in the business context that might affect accuracy. It is crucial to consider not just technical upkeep, but also aligning model objectives with evolving organizational priorities. By ensuring that every piece of feedback is integrated back into your model’s lifecycle, you are reinforcing the adaptability and resilience of your analytics system, thus paving the way for sustained success in turning raw data into actionable insights.
Data Storytelling
To successfully transform raw data into actionable insights, you must embrace the art of storytelling. Data storytelling is not just about presenting numbers and charts; it’s about weaving a narrative that resonates with your audience. When you share insights with stakeholders, you are not merely conveying facts; you are bringing your data to life. This requires you to understand who your audience is, what they value, and how they make decisions. By connecting the dots and illustrating the implications of your findings, you empower your audience to engage with the data on a personal level, catalyzing their understanding and prompting informed actions. Do not forget, data is rich with potential, but without a compelling story, its impact will be lost in a sea of statistics. You should strive to craft a narrative that simplifies complex truths, highlights the significance of the data, and ultimately guides stakeholders toward actionable outcomes.
Communicating Insights to Stakeholders
To communicate effectively with stakeholders, you need to tailor your insights to align with their specific interests and objectives. Every audience is different, and recognizing this will make your storytelling much more effective. You should consider the roles of the people you are communicating with—are they executives looking for high-level overviews, or are they ground-level employees needing operational details? By discerning the type of information that will resonate most with your audience, you can adjust your narrative accordingly. Use concepts they are familiar with, present comparisons that matter to them, and emphasize outcomes that directly impact their work or goals. This strategic approach not only grabs their attention but also instills confidence in the data you are presenting.
To further enhance your communication, utilize visualization tools to present your insights in an engaging manner. This is where the power of design comes into play. Well-crafted visuals—like graphs, charts, and infographics—can break down barriers of comprehension and bring your storytelling to life. They serve as touchpoints, allowing your stakeholders to visualize trends and patterns that would otherwise remain obscured in raw numbers. Your responsibility is to ensure that these visuals enhance the narrative rather than distract from it, so choose colors, layouts, and formats that support your message. Ultimately, this thoughtful design process is crucial in fostering a shared understanding, which is imperative for effective decision-making.
To cultivate an environment of collaboration and proactive discussion, consider inviting feedback and questions from your stakeholders. This interaction not only reinforces their engagement but also signals to you whether your message has been effectively communicated. Being open to questions encourages a two-way dialogue that transforms your data storytelling from a one-sided presentation into a meaningful conversation. By doing so, you involve your audience in the analytical process, enabling them to express their contexts, challenges, and solutions regarding the insights you’ve presented, thus enriching the discussion and enhancing the overall impact of your analysis.
Creating Interactive and Immersive Experiences
Stakeholders often seek greater engagement with the data and insights you provide. This is where creating interactive and immersive experiences becomes vital. By moving beyond static presentations to include interactive dashboards and dynamic visualizations, you empower your audience to explore the data for themselves. Adopting this approach allows stakeholders to manipulate the data, change variables, or zoom into specific areas of interest, fostering a deeper connection to the insights you’ve uncovered. You are not just sharing findings; you’re inviting them to journey through the data landscape alongside you, enriching their understanding and personalizing their experience. This level of engagement can lead to more informed decision-making and can spark innovative ideas that traditional presentations may not elicit.
This engagement can be further deepened through the use of virtual reality (VR) or augmented reality (AR) technologies, which can transform your data storytelling into immersive experiences that place the audience directly within the context of the data. Imagine walking stakeholders through a 3D representation of your data findings, demonstrating trends and patterns in a virtual space where they can interact directly with the information in real-time. Such innovative methods not only captivate your audience but also enable them to retain the insights more effectively. Turns out, this unique approach can elevate the way stakeholders perceive, interpret, and ultimately act upon the data you present. This shift in how you communicate insights opens up avenues for collaboration and fosters a culture of data-driven decision-making within your organization, ensuring that the journey from raw data to meaningful insights is not just a linear path but a dynamic exploration.
Data Governance
Keep in mind that effective data governance is crucial to translating raw data into meaningful insights. As you navigate the complex waters of data analytics, understanding how to maintain data quality and integrity becomes a fundamental consideration. This aspect of data governance demands a vigilant approach, ensuring that your data not only serves your immediate analytical needs but also withstands the scrutiny of various stakeholders over time. The reliability of your data plays a critical role in the conclusions you draw and the decisions you make. A commitment to data quality means instilling processes for continuous monitoring and cleansing of data sets, correcting errors, and flagging anomalies as they arise. This pursuit of excellence in data management becomes the bedrock upon which your insights will stand.
To ensure high data quality and integrity, you must establish and nurture a robust framework that includes defined data standards, processes, and ownership. By assigning data stewards, you create guardians of data integrity who can oversee the accuracy and consistency of the data across all touchpoints. These stewards foster a culture of accountability where accuracy is prized, ensuring that everyone within your organization understands their role in maintaining the fidelity of your data assets. Ultimately, the discipline you impose in maintaining data quality not only builds trust among your teams but also empowers you to make confident decisions based on reliable insights.
Moreover, it is vital to recognize that the quality of your data is an ongoing project rather than a one-time initiative. As data flows in from various sources, it is imperative to routinely assess its reliability, relevance, and timeliness. This calls for incorporating advanced data verification techniques, such as automated checks and balances, along with regular audits. By continually refining your approach to data quality and integrity, you ensure that your organization’s competitive edge remains sharp, providing valuable insights and guiding strategic decisions well into the future.
Data Security and Compliance
Governance in data security and compliance serves a dual purpose: it not only protects your organization from potential threats but also ensures that you adhere to increasingly complex regulatory requirements. As you break down the barriers between raw data and valuable insights, awareness of potential vulnerabilities is crucial. You are tasked with safeguarding sensitive data against unauthorized access, breaches, and other threats, while simultaneously ensuring compliance with government regulations such as GDPR, HIPAA, and others relevant to your industry. The challenge lies in striking a balance between unlocking the potential of your data and securing it from possible exploitation.
Keeping your data secure means implementing layered protection strategies that encompass everything from encryption and secure access controls to employee training programs. You need robust access management protocols to ensure that only authorized personnel can interact with sensitive data, thereby reducing the risk of internal threats. Furthermore, you should consider regular vulnerability assessments and penetration testing to reveal potential gaps in your security infrastructure. By embedding data security into your organizational culture, you offer your stakeholders and your customers peace of mind, knowing that their information is treated with utmost care and diligence.
Accompanying data security, compliance measures are paramount: adhering to regulations is no longer optional—it’s a necessity. Regulations serve not just as a framework to protect data, but also as a set of standards that shape your organization’s reputation in the marketplace. A commitment to compliance requires you to stay updated on the continuously evolving legal landscape and implement necessary adjustments in your data governance strategy. Establishing a culture of compliance ensures that every individual in your organization understands their responsibilities and the importance of safeguarding data. Quality data governance is about building trust through security and compliance, ultimately reinforcing your organization’s credibility and integrity in a world where data-driven insights are heralded as the gold standard.
Quality assurance in this context is an ever-evolving challenge. As data is more embedded into business processes, your organization should continually audit processes, improve infrastructures, and educate staff about the importance of compliance, ensuring that everyone is aligned with your governance goals. Investing the necessary resources in both data quality and data security thus becomes an investment in your organization’s future—one that cannot be underestimated in today’s data-driven world.
Scalability and Performance
Distributed Systems and Cloud Computing
Your journey into data analytics hinges significantly on the scalability and performance of the systems you choose to employ. Fortunately, modern technology provides you with powerful allies in distributed systems and cloud computing. These paradigms allow you to harness vast amounts of data while dynamically scaling your resources based on demand. Instead of relying on a single machine that may buckle under pressure, distributed systems enable you to spread out your workloads across multiple servers or nodes, each working in tandem to process and analyze data. This approach not only improves reliability and redundancy but also ensures that you can scale your analytics capabilities without experiencing bottlenecks in performance.
On the other hand, cloud computing serves as an excellent framework for executing your data analysis strategies. By shifting to cloud-based solutions, you can tap into virtually limitless resources and capabilities. Whether you need to store large datasets or implement complex algorithms, cloud providers offer a range of services designed specifically for data analytics. As you leverage these services, you also gain the flexibility to experiment with various tools and technologies, all while only paying for what you use. This model allows you to optimize your budget and is particularly advantageous for smaller organizations or startups eager to harness the power of data without a significant upfront investment.
Moreover, distributed systems and cloud computing equip you with crucial features like fault tolerance and load balancing. Imagine a scenario where one of your nodes fails during a crucial data analysis step; with a distributed architecture, other nodes can seamlessly take over the workload, ensuring continuity and preserving the integrity of your insights. Similarly, load balancing techniques can help distribute incoming data requests evenly across your system, preventing any single point from becoming a chokehold. By embracing these technologies, you not only enhance your analytics’ scalability but also bolster your confidence in the versatility and reliability of your data operations.
Optimizing Data Processing and Storage
Systems designed for data analytics often face challenges regarding the efficient processing and storage of vast amounts of information. You may find your workflows hampered as data volume grows; however, there are proven strategies you can employ to optimize these processes effectively. Techniques such as data partitioning, indexing, and compression can significantly enhance both processing speed and storage efficiency. By distributing data across various segments, you can ensure faster access times and improve query performance. Additionally, implementing robust indexing methods allows you to retrieve data swiftly, reducing the time spent on data retrieval tasks. Meanwhile, compression not only saves space but can help in speeding up data transfers between systems.
This optimization extends towards leveraging advanced technologies like in-memory computing and real-time data processing. By utilizing in-memory storage solutions, you can reduce the latency typically associated with traditional disk-based systems, enabling you to analyze data on-the-fly. In contrast, real-time processing ensures that you no longer have to wait for batch processing cycles to glean insights from your data. Instead, you can employ streaming analytics to understand incoming data as it flows in, allowing you to make timely decisions based on the most current information available. Such approaches lead to an environment where data becomes an immediate asset rather than a historical record, fundamentally transforming the way you perceive and utilize analytics.
Your exploration of optimizing data processing and storage integrates seamlessly into the broader context of data analytics. By understanding the interplay of various components within your system, you equip yourself with the tools necessary to not only handle increased data loads but also to derive actionable insights faster than ever before. The potential lies not just in the volume of data you can manage, but in how effectively you organize and access it. As you harness these techniques, your ability to drive meaningful and timely insights from raw data will undoubtedly be enhanced, paving the way for more informed decision-making.
Final Words
From above, it is clear that the journey from raw data to meaningful insights is not simply a linear process but a rich tapestry woven from technology, analysis, and creativity. As you navigate through this intricate landscape, each step offers a unique opportunity to deepen your understanding of not only the data at your disposal but also the countless possibilities it presents. You stand at the intersection of raw information and powerful insights, equipped with skills that can transform chaos into clarity. This journey implores you to question, analyze, and re-imagine the narrative that data can tell, urging you to tap into your innate curiosity and harness it to drive decision-making processes that can benefit your organization or personal endeavors.
Moreover, it is vital to recognize that the sheer volume of data being generated today can feel overwhelming, but it is in this very abundance that opportunity lies. You have the tools and methodologies at your disposal to sift through this data, allowing you to uncover patterns, correlations, and trends that may have otherwise gone unnoticed. The iterative process of data analytics emphasizes the need for patience and persistence, as each analysis enriches your understanding and, ultimately, the insights derived from them. Embrace the continuous learning aspect and leverage resources such as From Data to Insights: A Practical Approach to Data Science to refine your skills and remain updated on the evolving landscape of data analytics.
As you reflect on your own journey into data analytics, remember that it is not merely about crunching numbers, but rather uncovering the underlying stories that shape the world around you. Being a data analyst means adopting a mindset of exploration, armed with the resolve to seek answers where none seem readily available. The insights you gain can influence strategies, drive innovation, and foster growth in ways that you may not have imagined. Thus, as you continue on this path, nurture your inquisitiveness, embrace the challenges, and revel in the discoveries, for the journey from raw data to insights ultimately expands not just your knowledge but also your capacity to make an impactful difference in our data-driven society.
FAQ
Q: What is data analytics and why is it important?
A: Data analytics is the process of examining raw data with the purpose of drawing conclusions about that information. Through various techniques and tools, data analytics allows businesses to uncover patterns, correlations, and insights that inform decision-making. It is important because it helps organizations improve efficiency, optimize operations, enhance customer satisfaction, and drive revenue growth.
Q: What are the key steps involved in the data analytics journey?
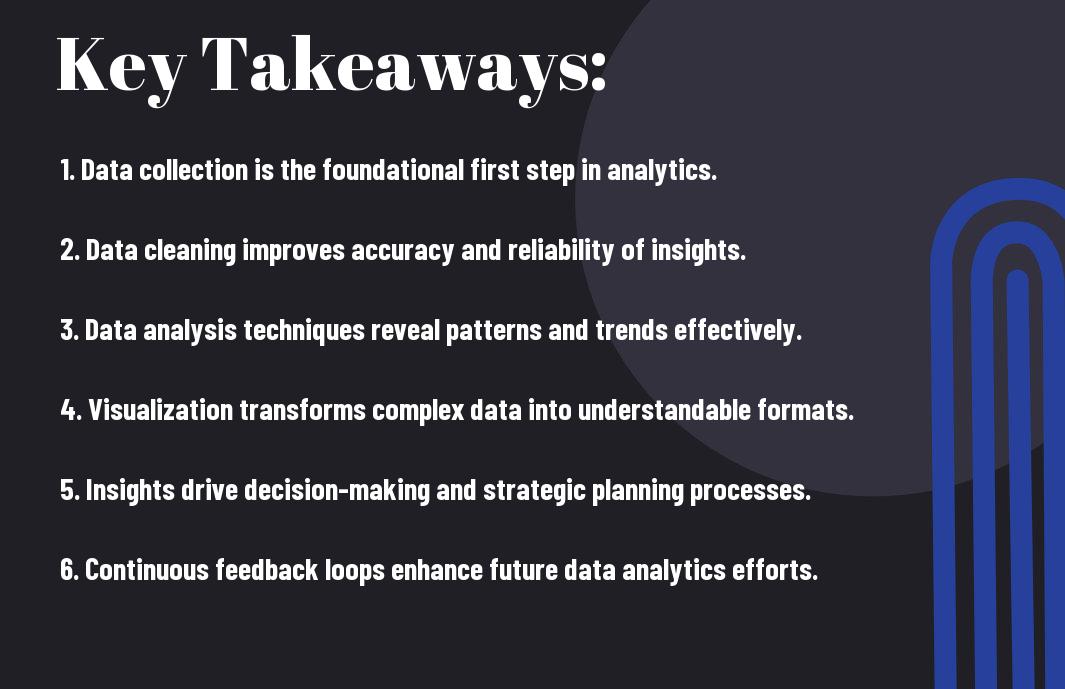
A: The key steps in the data analytics journey typically include the following:
1. Data Collection: Gathering raw data from various sources.
2. Data Cleaning: Removing inaccuracies and ensuring the data is formatted correctly.
3. Data Analysis: Applying statistical and computational techniques to discover trends and patterns.
4. Data Visualization: Presenting data insights in a clear and understandable format through charts and graphs.
5. Interpretation: Understanding the implications of the analysis to make informed decisions and strategic plans.
Q: What types of data can be analyzed?
A: Data can come in many forms and can be analyzed based on its type. Common data types include:
– Structured Data: Organized data often found in databases, like sales figures or customer information.
– Unstructured Data: Unorganized data such as emails, social media posts, and images.
– Semi-structured Data: A mix of both, such as XML files or JSON, which still carry some hierarchical structure.
Different types require various analysis techniques and tools.
Q: What tools and technologies are commonly used in data analytics?
A: Numerous tools and technologies are employed in data analytics, ranging from programming languages to software applications. Common tools include:
– Programming Languages: Python and R for statistical analysis.
– Data Visualization Tools: Tableau, Power BI, and Google Data Studio for presenting findings visually.
– Data Warehousing Solutions: Amazon Redshift, Snowflake, and Google BigQuery for storing large volumes of data.
– Machine Learning Libraries: TensorFlow and Scikit-learn for predictive analytics.
The choice of tool often depends on the specific needs of the project and the expertise of the data analysts involved.
Q: How can organizations ensure the quality of their data analysis?
A: To ensure quality in data analysis, organizations can adopt several best practices:
1. Establish Data Governance: Develop a framework to manage data quality, accessibility, and security.
2. Perform Regular Data Audits: Monitor data quality regularly to identify and rectify issues promptly.
3. Use Proper Data Cleaning Techniques: Implement systematic approaches to clean the data before analysis.
4. Encourage Cross-Department Collaboration: Enable communication between different departments to align data strategies and share insights.
5. Invest in Training: Equip staff with necessary skills and knowledge to interpret data accurately and responsibly.
By maintaining a focus on data quality, organizations can make more reliable decisions based on accurate insights.