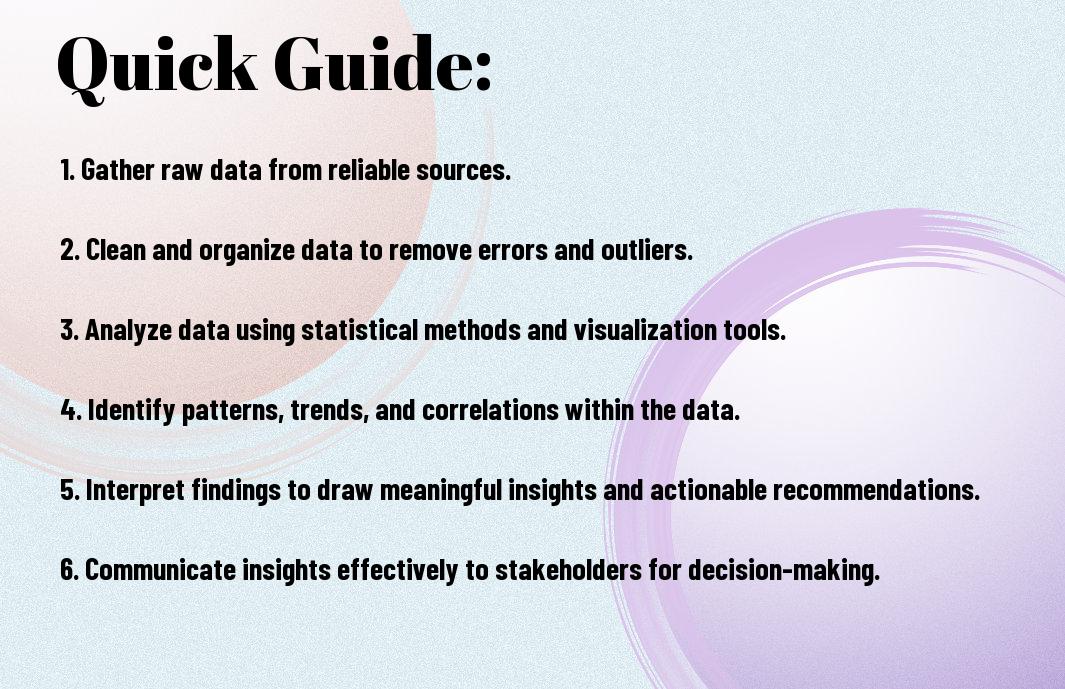
Many times, raw data can be overwhelming, confusing, and seem impossible to make sense of. However, with the right approach, you can turn this data into valuable insights that drive informed decisions. This step-by-step guide will walk you through the process of transforming raw data into actionable insights that can help you make a real impact.
Key Takeaways:
- Data Cleaning: Proper data cleaning is important to ensure accurate and reliable insights.
- Data Analysis: Utilize various analytical techniques to identify patterns and trends within the data.
- Visualization: Visual representations of data can help in understanding complex relationships and making informed decisions.
- Interpretation: It is crucial to interpret the results of the analysis in the context of the problem at hand.
- Communication: Effectively communicate the insights derived from the data to stakeholders to drive actionable outcomes.
- Iteration: The data analysis process may require multiple iterations to refine the insights and improve the outcomes.
- Continuous Improvement: Regularly review and optimize the data analysis process to enhance the quality of insights generated.
Understanding Raw Data
For a data analyst or scientist, the journey to deriving actionable insights begins with understanding raw data. Raw data is the unprocessed and unorganized data collected from various sources. This data is the foundation upon which all analysis and decision-making are based. Without a clear understanding of the raw data, your insights may be inaccurate or misleading.
Types of Raw Data
Understanding the different types of raw data is crucial for effective analysis. The two main types of raw data are structured and unstructured data. Structured data is organized and easily searchable, such as data in databases or spreadsheets. On the other hand, unstructured data is not easily searchable or organized, such as text documents or social media posts. This data can be more challenging to work with but can also provide valuable insights.
This breakdown of raw data into structured and unstructured data can help you better understand the nature of the data you are dealing with. It is important to identify the type of data you are working with before proceeding with any analysis. This knowledge will inform the tools and techniques you need to use to extract insights from the data.
| Structured Data | Unstructured Data |
|---|---|
| Organized and searchable | Not easily organized |
| Found in databases/spreadsheets | Found in text documents/posts |
| Easier to work with | Challenging to work with |
| Provides valuable insights | Potentially valuable insights |
Characteristics of Raw Data
Characteristics of raw data include its volume, velocity, variety, and veracity. Volume refers to the amount of data collected, while velocity refers to the speed at which the data is generated and collected. Variety signifies the different types of data sources, and veracity relates to the accuracy and reliability of the data. Understanding these characteristics can help you assess the quality and relevance of the data for your analysis.
Data analysts must also consider the granularity, relevance, and context of the raw data. Granularity refers to the level of detail in the data, while relevance pertains to the significance of the data to the analysis. Context is imperative for interpreting the data accurately within the broader business or research context. Taking these characteristics into account ensures that your analysis is based on trustworthy and applicable data.
Data quality is another critical characteristic of raw data. Poor data quality can lead to incorrect conclusions and flawed insights. By assessing the quality of the data in terms of accuracy, completeness, and consistency, you can ensure the reliability of your analysis results. Clean, high-quality data is vital for making informed decisions and driving positive outcomes.
Importance of Raw Data in Decision-Making
Data is the lifeblood of decision-making in the digital age. The raw data you collect and analyze directly impacts the quality and effectiveness of your decisions. Without accurate and reliable data, your decisions may be based on assumptions rather than facts. By leveraging raw data effectively, you can gain valuable insights that drive strategic decision-making and business growth.
The importance of raw data in decision-making cannot be overstated. Your ability to extract actionable insights from raw data can give you a competitive edge in any industry. By harnessing the power of data analytics, you can uncover trends, patterns, and correlations that guide your decision-making process. With the right tools and techniques, you can turn raw data into valuable insights that propel your business forward.
Types of data such as customer preferences, market trends, and operational performance are key drivers of strategic decisions. By analyzing raw data effectively, you can optimize processes, identify opportunities, and mitigate risks. The transformative potential of raw data lies in its ability to inform your decisions, enhance your strategies, and ultimately, drive success in your endeavors.
Data Preparation
It is crucial to properly prepare your data before you can derive any meaningful insights from it. This process includes data cleaning, transformation, and quality control measures to ensure the data is accurate, complete, and reliable.
Step-by-Step Guide to Data Cleaning
You should start by identifying and handling missing data in your dataset. This can involve deleting rows with missing values, imputing missing values using statistical methods, or using machine learning algorithms to predict missing values.
| Action | Description |
| Remove duplicates | Identify and eliminate duplicate entries in your data. |
| Correct data types | Ensure that data types are appropriate for analysis (e.g., converting text to numbers). |
Once you have cleaned your data, you can move on to the next step of data transformation.
Data Transformation Techniques
One of the crucial aspects of data preparation is transforming the data into a format that is suitable for analysis. This can involve normalization, scaling, encoding categorical variables, and creating new features through feature engineering.
Data transformation techniques help make your data more manageable and enhance the performance of machine learning models by providing them with standardized and relevant input.
Data Quality Control Measures
Little errors in your data can lead to significant issues in your analysis and decision-making. Implementing data quality control measures such as outlier detection, validation checks, and data profiling can help ensure your data is accurate, consistent, and reliable.
This step is crucial as it helps identify and rectify any discrepancies or anomalies in your data that could skew your results and conclusions.
Transformation
This process of data preparation may seem tedious, but it is a critical step in the data analysis pipeline. By ensuring your data is clean, transformed, and of high quality, you can trust the insights and decisions derived from it, leading to more effective and informed actions.
Data Analysis
Despite having access to a wealth of raw data, the true value lies in the analysis that transforms it into actionable insights. Data analysis is a crucial step in the process that allows you to uncover patterns, trends, and relationships within your data, ultimately leading to informed decision-making.
Types of Data Analysis
To effectively analyze your data, you need to understand the different types of analysis techniques available. Here are some common types of data analysis:
- Descriptive Analysis – Focuses on describing and summarizing the main features of a dataset.
- Diagnostic Analysis – Aims to identify the factors that contribute to a particular outcome.
- Predictive Analysis – Involves forecasting future trends based on historical data.
- Prescriptive Analysis – Recommends actions to optimize a result or achieve a specific goal.
- Exploratory Analysis – Seeks to discover hidden patterns or relationships in the data.
Recognizing the appropriate type of analysis for your data is necessary in extracting meaningful insights that can drive your business forward.
Factors to Consider When Choosing an Analysis Technique
Now that you are familiar with the types of data analysis, it’s important to consider various factors when selecting the right analysis technique for your dataset. Some key factors to keep in mind include:
- Data Type – Different analysis techniques are suitable for different types of data, such as numerical, categorical, or textual data.
- Goal – Clarify the objective of your analysis to determine the most relevant technique to use.
- Complexity – Consider the complexity of the analysis technique and ensure it matches your technical expertise.
- Time and Resources – Evaluate the time and resources required to conduct the analysis and choose a technique that aligns with your constraints.
- Interpretability – Ensure that the results of the analysis are easily interpretable and can be translated into actionable insights.
Though these factors may seem overwhelming at first, taking the time to carefully assess them will lead to more accurate and valuable insights from your data.
Tips for Effective Data Analysis
Data analysis can be a complex process, but there are some tips that can help you navigate it more effectively:
- Define Your Objectives – Clearly outline your goals and what you hope to achieve through the analysis.
- Clean Your Data – Ensure your data is accurate and free from errors before conducting any analysis.
- Visualize Your Data – Use charts, graphs, and other visual tools to better understand your data and identify patterns.
- Iterate and Refine – Continuously review and refine your analysis to ensure you are extracting the most relevant insights.
- Assume that your data is telling a story – Approach your data analysis with a narrative mindset, looking for the plot and characters that drive the story of your data.
Factors such as data cleanliness, appropriate tools, and a clear analysis plan are crucial to the success of your data analysis process. It’s important to take the time to consider these factors carefully to ensure that your analysis yields accurate and valuable results.
When
Assume that your data has the potential to uncover valuable insights that can shape the future of your business. By approaching data analysis with the right techniques and mindset, you can turn raw data into actionable insights that drive success.
Data Visualization
Importance of Data Visualization
Many companies today collect vast amounts of data from various sources, but without data visualization, all that data remains meaningless. Data visualization is crucial because it helps you clearly see trends, patterns, and outliers in your data. By representing data visually through charts, graphs, and maps, you can easily interpret complex data sets and identify key insights at a glance.
Moreover, data visualization makes it easier for you to communicate your findings with stakeholders. Rather than presenting them with rows and columns of numbers, you can create interactive visualizations that tell a story and support your recommendations. This not only enhances understanding but also drives better decision-making based on actionable insights derived from the data.
Without data visualization, you may struggle to make sense of your data and may miss important opportunities or risks. Visualizing your data is the first step towards unlocking its true potential and turning it into valuable business intelligence.
Types of Data Visualization Tools
Clearly, there are various data visualization tools available to help you turn your raw data into meaningful visuals. These tools range from simple, user-friendly platforms like Microsoft Excel and Google Sheets to more advanced, specialized software such as Tableau, Power BI, and D3.js. Each tool offers unique features and capabilities for creating different types of visualizations.
- Microsoft Excel: user-friendly tool for creating basic charts and graphs
- Tableau: powerful software for interactive dashboards and complex visualizations
- Power BI: Microsoft’s business analytics tool for creating reports and dashboards
- Google Data Studio: free tool for creating interactive reports and dashboards
- D3.js: JavaScript library for creating custom, interactive data visualizations
Recognizing which data visualization tool is most suitable for your needs depends on factors such as data volume, complexity, and your level of expertise. It’s vital to choose the right tool that aligns with your goals and objectives to effectively visualize and analyze your data.
Best Practices for Data Visualization
The best practices for data visualization involve choosing the right type of visualization for your data, keeping it simple, and focusing on clarity. Each visualization should have a clear purpose and should convey information efficiently and accurately. Avoid cluttering your visuals with unnecessary elements that can distract from the main message.
When creating visualizations, pay attention to color schemes, labels, and fonts to ensure that the information is presented clearly and is easy to interpret. Use interactive features where applicable to allow users to explore the data further and gain deeper insights. Lastly, test your visualizations with a sample audience to ensure they understand the information you are trying to convey.
Practicing good data visualization techniques not only enhances the presentation of your data but also enables you to tell a compelling story that resonates with your audience. By following these best practices, you can create engaging visualizations that drive data-driven decision-making within your organization.
Identifying Patterns and Trends
Once again, as you probe deeper into your data analysis journey, the next crucial step is identifying patterns and trends within your dataset. This step is necessary as it allows you to uncover valuable insights that can inform decision-making and drive strategic actions. By recognizing patterns and trends, you can better understand the underlying dynamics of your data and make more informed choices based on these observations.
Step-by-Step Guide to Identifying Patterns
To identify patterns effectively, follow this step-by-step guide:
| Step 1 | Explore your data visually through charts, graphs, and dashboards. |
| Step 2 | Use statistical tools like regression analysis or time series modeling to uncover relationships and trends. |
| Step 3 | Employ data mining techniques such as clustering or association analysis to detect hidden patterns. |
Factors to Consider When Identifying Trends
When identifying trends in your data, several factors should be taken into account:
- Timeframe: Analyze data over a specific period to capture meaningful trends.
- Seasonality: Consider cyclical patterns that may affect your data over time.
- Outliers: Identify and address anomalies that could skew your trend analysis.
Knowing the context in which your data was collected is crucial for interpreting trends accurately and drawing actionable insights from them.
Tips for Avoiding False Positives
With respect to identifying trends, avoiding false positives is key to ensuring the reliability of your analysis. Here are some tips to help you navigate this challenge:
- Validate: Confirm trends with additional data sources to verify their consistency.
- Consider the Big Picture: Look at trends in conjunction with other metrics to gain a comprehensive understanding.
- Apply Statistical Significance: Use statistical tests to determine the reliability of identified trends.
Any data analysis is only as good as the accuracy of the trends identified, so it’s crucial to be vigilant in avoiding false positives that could lead to misguided decisions.
Data Mining
To examine deeper into data analysis, you need to understand the various types of data mining techniques that are commonly used. These techniques help you uncover patterns, trends, and insights from your raw data. The main types of data mining techniques include classification, clustering, regression, association, and anomaly detection. Each technique serves a unique purpose in extracting valuable information from your datasets.
After gaining familiarity with these data mining techniques, you can apply them based on the specific goals of your analysis. Classification helps in categorizing data into predefined classes, while clustering groups similar data points together. Regression predicts numerical values based on historical data, association uncovers relationships between variables, and anomaly detection identifies unusual patterns that deviate from normal behavior. To better understand these techniques, refer to the table below for a concise comparison.
| Classification | Categorizes data into predefined classes |
| Clustering | Groups similar data points together |
| Regression | Predicts numerical values based on historical data |
| Association | Uncovers relationships between variables |
| Anomaly Detection | Identifies unusual patterns that deviate from normal behavior |
Pros and Cons of Data Mining
There’s a set of advantages and disadvantages associated with data mining that you should be aware of. On one hand, the pros include improved decision-making, increased efficiency, new opportunities discovery, automated predictions, and identifying trends. However, on the flip side, some cons involve privacy concerns, potential biases, data security risks, interpretation challenges, and complexity in implementation. To make informed decisions, refer to the table below for a comprehensive overview.
| Improved Decision-making | Enhances the quality of decisions based on data insights |
| Increased Efficiency | Streamlines processes and saves time in data analysis |
| New Opportunities Discovery | Uncovers potential business opportunities and growth areas |
| Automated Predictions | Allows for automated forecasting and decision support |
| Identifying Trends | Helps in spotting trends and patterns for strategic planning |
| Privacy Concerns | Raises issues related to data privacy and confidentiality |
| Potential Biases | May introduce biases in data analysis results |
| Data Security Risks | Exposes data to security threats and vulnerabilities |
| Interpretation Challenges | Difficulty in interpreting complex data mining results |
| Complexity in Implementation | Requires specialized skills and resources for effective implementation |
There’s always a balance to strike between the advantages and disadvantages of data mining, and your approach will depend on your specific business needs and ethical considerations. By carefully weighing the pros and cons, you can harness the power of data mining while mitigating potential risks. In your data journey, remember to prioritize data security, ethical practices, and continuous learning to maximize the benefits of data mining.
Real-World Applications of Data Mining
Aiming to understand the practical implications of data mining, you can explore its real-world applications across various industries. Financial institutions use data mining for fraud detection, retail companies employ it for market basket analysis, healthcare organizations utilize it for patient outcome prediction, telecommunication companies apply it for customer churn prediction, and e-commerce platforms leverage it for personalized recommendations.
While these are just a few examples, data mining finds widespread applications in diverse sectors for improving operational efficiency, enhancing customer experience, increasing revenue generation, optimizing resource allocation, and fostering innovation. By tapping into the potential of data mining, you can gain valuable insights to drive strategic decisions and stay ahead in today’s competitive landscape.
With real-world applications spanning across industries, you have the opportunity to harness the power of data mining in your own organization. From uncovering hidden patterns to predicting future trends, data mining enables you to extract actionable insights that drive meaningful outcomes. By staying informed about the latest trends and best practices in data mining, you can unlock the full potential of your data assets for impactful decision-making.
Predictive Analytics
Once again, we examine into the world of predictive analytics, where data scientists leverage historical data to forecast future outcomes. Predictive analytics is a powerful tool that can help businesses make informed decisions, anticipate customer behavior, and optimize processes. By building predictive models, organizations can extract valuable insights from data and gain a competitive edge in the market.
Step-by-Step Guide to Building Predictive Models
Below is a step-by-step guide to building predictive models:
| Step | Description |
| Data Preprocessing | Clean and prepare the data by handling missing values, encoding categorical variables, and scaling features. |
| Feature Selection | Identify the most relevant features that contribute to the predictive power of the model. |
| Model Building | Choose an appropriate algorithm, split the data into training and testing sets, and train the model. |
| Model Evaluation | Assess the model’s performance using metrics like accuracy, precision, recall, and F1 score. |
| Hyperparameter Tuning | Optimize the model by fine-tuning hyperparameters through techniques like grid search or random search. |
Factors to Consider When Evaluating Model Performance
You must consider several factors when evaluating the performance of a predictive model:
- Accuracy: Measure of the proportion of true positives and true negatives in the predictions.
- Precision: Ability of the model to correctly identify positive cases.
- Recall: Ability of the model to capture all positive cases.
- F1 Score: Balance between precision and recall, useful for imbalanced datasets.
Guide on how to interpret these metrics and choose the most suitable ones based on your business objectives and the nature of your data. Thou, selecting the right evaluation metrics is crucial for determining the effectiveness of your predictive model.
Tips for Avoiding Overfitting
Step-by-Step, overfitting occurs when a model performs well on training data but fails to generalize to new, unseen data. Here are some tips to avoid overfitting:
- Cross-Validation: Split data into multiple folds for training and testing to evaluate the model’s performance more effectively.
- Regularization: Add a penalty term to the loss function to prevent the model from fitting the training data too closely.
- Feature Selection: Choose only the most relevant features to reduce complexity and improve generalization.
Evaluating models can help you identify signs of overfitting, such as a significant gap between the training and testing performance. Any model that exhibits overfitting is at risk of making inaccurate predictions on new data, ultimately degrading its practical utility.
When working on predictive analytics projects, it is vital to continuously assess model performance, watch out for signs of overfitting, and make adjustments accordingly to ensure the reliability and effectiveness of the predictive models. Note, the goal is not just to build accurate models but to generate actionable insights that drive business decisions and outcomes.
Big Data Analytics
All data has a story to tell, but not all data is created equal. Concerning transforming raw data into actionable insights, you need to leverage the power of big data analytics. To learn more about this process, refer to our Guide to Transform Data into Actionable Insights.
Characteristics of Big Data
Analytics of big data is characterized by the three V’s – Volume, Velocity, and Variety. Volume refers to the sheer amount of data generated every second, while Velocity relates to the speed at which this data is produced and must be analyzed. Variety encompasses the different types of data sources and formats, from structured to unstructured data like text, images, and videos.
Challenges of Analyzing Big Data
Some of the challenges you may encounter when analyzing big data include processing large volumes of data in real-time, ensuring data quality and security, and integrating data from diverse sources. It can be overwhelming to manage and make sense of such massive amounts of data, especially if your organization lacks the proper tools and expertise.
Opportunities and Benefits of Big Data Analytics
If you can effectively harness the power of big data analytics, you will unlock a world of opportunities. By analyzing patterns and trends within your data, you can make informed business decisions, identify new revenue streams, improve operational efficiency, and gain a competitive edge in your industry. With the right tools and strategies in place, the benefits of big data analytics are limitless.
Machine Learning
Your journey into the world of machine learning involves understanding different types of algorithms to make informed decisions.
Types of Machine Learning Algorithms
Machine learning algorithms can be categorized into three main types – supervised, unsupervised, and reinforcement learning. In supervised learning, the algorithm learns from labeled data to predict outcomes. Unsupervised learning involves finding hidden patterns in unlabeled data. On the other hand, reinforcement learning utilizes a trial-and-error approach to learn from experience.
This information can be visually represented in the following table:
| Supervised Learning | Predict outcomes using labeled data |
| Unsupervised Learning | Discover hidden patterns in unlabeled data |
| Reinforcement Learning | Learn from experience through trial-and-error |
When choosing a machine learning algorithm,
Factors to Consider When Choosing a Machine Learning Algorithm
there are several crucial factors to keep in mind. These include the size and quality of your data, the complexity of the problem, and the interpretability of the model. Additionally, computational efficiency and scalability are crucial considerations.
To further aid your decision-making process, consider the following:
- Data Size and Quality: Ensure you have enough high-quality data for training.
- Problem Complexity: Choose an algorithm that can handle the complexity of your problem.
- Interpretability: Decide whether you need to understand how the model makes predictions.
Recognizing these factors will help you select the most appropriate machine learning algorithm for your specific use case.
To dive deeper into the selection process, factor in additional considerations like the interpretability of the model, the availability of resources for implementation, and the potential impact on stakeholders. Recognizing these elements will lead you to choose a machine learning algorithm that aligns with your project goals and constraints.
A successful machine learning model hinges on proper training and testing.
Tips for Training and Testing Machine Learning Models
When training your model, ensure you have a separate validation set to tune hyperparameters effectively. Regularization techniques can prevent overfitting, while cross-validation helps assess model performance. Perceiving the nuances of training and testing processes is crucial for developing robust machine learning models.
Clearly understanding these tips, along with the importance of feature engineering and the impact of hyperparameters, will enhance your model’s performance. Perceiving these nuances will enable you to fine-tune your machine learning models effectively.
Data Storytelling
Importance of Data Storytelling
Now that you have gathered all the raw data and processed it into meaningful insights, it’s time to communicate your findings effectively. Data storytelling is the art of translating complex data into a compelling narrative that is easy to understand and resonates with your audience. By weaving your insights into a story, you can make the data more relatable and memorable.
Even the most powerful insights can get lost if they are not presented in a way that grabs attention and engages the audience. Data storytelling helps you connect with your stakeholders on an emotional level, making it more likely that they will take action based on your insights. Whether you are presenting to executives, clients, or colleagues, a well-crafted data story can inspire change and drive decision-making.
Effective data storytelling is imperative for driving impact and fostering a data-driven culture within your organization. By presenting data in a compelling narrative, you can influence key stakeholders and drive meaningful change. Don’t underestimate the power of storytelling when it comes to making your data insights actionable.
Types of Data Storytelling Techniques
Types of data storytelling techniques include data visualization, data-driven narratives, case studies, interactive dashboards, and infographics. Each technique has its own strengths and can be used to convey different types of insights. Using a combination of these techniques can help you cater to different audience preferences and effectively communicate your findings.
- Data visualization: Creating charts, graphs, and other visual representations of data.
- Data-driven narratives: Telling a story based on the insights derived from the data.
- Case studies: Presenting real-world examples that illustrate the impact of the data.
- Interactive dashboards: Allowing the audience to explore the data themselves.
- Infographics: Using visual elements to convey complex information in an easily digestible format.
After selecting the most appropriate technique for your data story, you can enhance the effectiveness of your presentation and ensure that your insights are understood and actioned upon.
Best Practices for Effective Data Storytelling
Importance of incorporating best practices for data storytelling cannot be overstated. When telling a story with data, it’s important to keep your audience in mind. Tailor the narrative to their level of understanding and use visuals to support your message. Focusing on the key takeaways and structuring your story in a logical flow will help engage your audience and drive the desired outcome.
For instance, using a clear and concise narrative that highlights the most important insights can ensure that your audience stays engaged and retains the information. Incorporating real-world examples and humanizing the data can make the story more relatable and impactful. Recall, the goal of data storytelling is not just to inform but to inspire action.
Importance of practicing transparency and authenticity in your data storytelling efforts. Be honest about the limitations of the data and acknowledge any uncertainties. By being transparent, you build credibility and trust with your audience, which is imperative for driving meaningful change based on data insights. Always strive to make your data story clear, compelling, and actionable.
Actionable Insights
Keep From Raw Data to Actionable Insights: A Guide…
Step-by-Step Guide to Deriving Actionable Insights
Deriving actionable insights from raw data is a crucial step in the data science workflow. The process involves transforming data into valuable information that can drive strategic decisions and business outcomes. Here is a breakdown of the steps you can follow to derive actionable insights:
| Step | Description |
| Data Collection | Collect relevant data from various sources. |
| Data Cleaning and Preprocessing | Clean and preprocess the data to ensure its quality and accuracy. |
| Data Analysis | Analyze the data using statistical and machine learning techniques to extract meaningful insights. |
Factors to Consider When Communicating Insights
When communicating insights derived from data analysis, there are several factors you need to consider to ensure clarity and effectiveness. These factors include:
- Audience: Understand the background and knowledge level of your audience.
- Visualization: Use visual aids like charts and graphs to present complex data in a clear and concise manner.
- Context: Provide context around the insights to help stakeholders understand the implications.
Recognizing these factors and tailoring your communication accordingly will make your insights more impactful and actionable.
Tips for Ensuring Insights Drive Business Decisions
Insights derived from data analysis are only valuable if they lead to tangible business outcomes. Here are some tips to ensure that your insights drive informed decision-making:
- Focus on Key Metrics: Identify the key performance indicators that align with your business goals.
- Collaborate with Stakeholders: Involve key stakeholders in the data analysis process to gain diverse perspectives.
- Monitor and Evaluate: Continuously monitor the impact of your insights on business decisions and adjust strategies accordingly.
Though deriving insights is crucial, translating them into actionable strategies is what ultimately drives business success. By following these tips, you can ensure that your insights are leveraged effectively to make data-driven decisions.
Overcoming Common Challenges
Common Challenges in Data Analysis
Unlike in controlled environments, real-world data analysis comes with its own set of challenges. You may encounter issues such as missing data, outliers, inaccurate data entry, and data inconsistencies. These challenges can hinder the accuracy and reliability of your analysis, ultimately leading to flawed insights and decisions.
You must be prepared to address these common challenges effectively to ensure that your analysis is robust and reliable. By understanding the root causes of these issues and implementing appropriate strategies, you can overcome these obstacles and extract valuable insights from your data.
Note, data analysis is not just about crunching numbers – it’s about navigating through potential roadblocks to uncover meaningful patterns and trends that drive informed decision-making.
Strategies for Overcoming Data Quality Issues
Analysis of poor-quality data can lead to misleading results and erroneous conclusions. Therefore, it is crucial to implement strategies to address data quality issues effectively. The first step is to identify the sources of data errors and inconsistencies. Conducting data profiling and cleaning processes can help you detect and rectify inaccuracies in the data.
The next step is to establish data validation protocols and standards to ensure the accuracy and reliability of the data being analyzed. Regular data audits and checks can help you maintain the quality of your dataset and minimize the risk of making decisions based on faulty information.
By prioritizing data quality and adopting a proactive approach to data validation, you can enhance the integrity of your analysis and derive more reliable insights for actionable decision-making.
Tips for Managing Stakeholder Expectations
The success of your data analysis efforts often hinges on how well you manage stakeholder expectations. Effective communication, transparency, and setting realistic timelines are key to ensuring that stakeholders understand the limitations and possibilities of the analysis process.
- Clearly define the objectives and scope of the analysis to align stakeholders’ expectations with what is achievable.
- Provide regular updates and progress reports to keep stakeholders informed and engaged throughout the analysis process.
- Be prepared to explain the methodology, assumptions, and potential uncertainties in the data to manage stakeholders’ expectations effectively.
By establishing open lines of communication and managing expectations proactively, you can build trust and confidence with your stakeholders, ultimately leading to more successful outcomes. Any misunderstandings or discrepancies can be addressed early on, minimizing the risk of disappointments or misinterpretations.
Best Practices for Data-Driven Decision-Making
Importance of Data-Driven Decision-Making
After gathering and processing all your data, the next crucial step is converting that raw information into actionable insights. This transformation is where the importance of data-driven decision-making comes into play. By utilizing data-driven practices, you can make informed decisions based on factual evidence rather than intuition or guesswork. This approach helps you identify patterns, trends, and correlations that may not be immediately apparent, leading to more accurate and effective decision-making.
Now, imagine a scenario where you have access to a wealth of information but are unable to extract meaningful insights from it. Without a structured approach to interpreting data, you could miss out on valuable opportunities and risk making decisions that are not well-informed. Embracing data-driven decision-making empowers you to leverage the full potential of your data by deriving insights that drive strategic and operational actions. This methodology provides a solid foundation for improving performance, optimizing processes, and gaining a competitive edge in your industry.
Data-driven decision-making is not just about the technical aspects of handling data; it’s a mindset shift that permeates your organization. By embedding a data-driven culture, you foster a collaborative environment where decisions are based on evidence rather than personal opinions or biases. This holistic approach ensures that data becomes a strategic asset that guides every aspect of your business, leading to better outcomes and sustainable growth. Recognizing the significance of data-driven decision-making is crucial for staying ahead in today’s fast-paced business landscape.
Factors to Consider When Implementing Data-Driven Decision-Making
Data-driven decision-making involves several key factors that are crucial for successful implementation. These factors include the quality and reliability of your data, the tools and technologies used for analysis, the skills and expertise of your team members, and the overall data governance framework in place. Ensuring that these elements are optimized and aligned is crucial for deriving meaningful insights that drive impactful decisions.
- Data quality and reliability are foundational to the success of data-driven decision-making. Without accurate and up-to-date data, your insights may be flawed, leading to erroneous conclusions and misguided actions.
- The tools and technologies you use to analyze data play a significant role in the effectiveness of your decision-making process. Investing in advanced analytics tools and platforms can help you uncover hidden patterns and trends that manual analysis may overlook.
- Having a team with the right skills and expertise is critical for translating data into actionable insights. Data scientists, analysts, and business stakeholders must work together cohesively to ensure that decisions are well-informed and aligned with organizational goals.
- Establishing a robust data governance framework is vital for maintaining the integrity and security of your data. Clear protocols for data collection, storage, and usage help mitigate risks and ensure compliance with regulatory requirements.
Data-driven decision-making requires a strategic approach that goes beyond just crunching numbers. Recognizing the interconnectedness of data, tools, skills, and governance is key to building a solid foundation for leveraging data effectively in decision-making processes.
Tips for Sustaining a Data-Driven Culture
Implementing a data-driven culture is a continuous effort that requires ongoing commitment and reinforcement within your organization. By following these best practices, you can ensure that your data-driven initiatives are sustainable and yield long-term benefits for your business.
- Encourage a collaborative approach to data-driven decision-making, involving stakeholders from different departments and levels of the organization. This fosters a culture of transparency and accountability, where insights are shared and decisions are made collectively.
- Provide continuous training and development opportunities for your team members to enhance their data literacy and analytical skills. Investing in skill-building programs ensures that your workforce is equipped to handle data effectively and derive valuable insights from it.
- The regular review and assessment of your data-driven initiatives are crucial for identifying areas of improvement and optimizing your processes. By soliciting feedback and monitoring key performance indicators, you can adjust your strategies to align with changing business needs and goals.
For instance, establishing a cross-functional data team comprising members from different departments can promote knowledge sharing and collaboration, leading to more comprehensive insights and better decision-making outcomes. The cohesive efforts of this team can help bridge silos, break down communication barriers, and foster a culture where data is valued as a strategic asset. The success of data-driven decision-making hinges on creating an environment where data is not just an afterthought but a central driving force behind every business decision. The continuous reinforcement of this mindset is crucial for sustaining a data-driven culture that drives innovation, efficiency, and growth.
Summing up
With this in mind, as you navigate through each step outlined in From Raw Data to Actionable Insights: A Step-by-Step Guide, you are equipping yourself with the necessary tools to transform raw data into valuable insights. By following the structured approach presented in the guide, you are not only gaining a better understanding of your data but also unlocking its potential to drive informed decision-making within your organization.
Throughout the guide, you have discovered the importance of data preparation, analysis, visualization, and interpretation in the journey towards actionable insights. By embracing each phase and leveraging the recommended techniques and tools, you are enhancing your ability to extract meaningful information from complex datasets. Your newfound skills in data transformation and analysis are empowering you to make strategic choices and steer your company towards success in an increasingly data-driven business landscape.
Note, the process of turning raw data into actionable insights is an iterative one. With each dataset you work on, you further refine your analytical capabilities and deepen your understanding of the underlying patterns and trends. By continuously applying the methodologies presented in the guide and staying curious about the stories your data can tell, you are poised to become a proficient data interpreter, driving positive change and innovation within your organization.