
Discover the essential foundations of data engineering and how it shapes the world of big data in this comprehensive guide.

Table of Contents
Welcome, teachers-turned-data-analysts! As you embark on your data analytics journey, it’s crucial to understand the ins and outs of data engineering. Data engineering forms the foundation of effective data analysis, ensuring that the right data is collected, stored, processed, and analyzed to derive meaningful insights. In this beginner’s guide, we’ll delve into 10 essential tips for optimizing your data engineering processes for analytics.
Understand Data Lineage
One key aspect of data engineering that often gets overlooked is data lineage. Data lineage refers to the complete record of all the components and processes that interact with data from its origin to its final destination. Understanding data lineage is crucial for effective data governance, as it allows you to track and audit the flow of data throughout your organization. By maintaining a clear data lineage, you can ensure data integrity, traceability, and compliance with regulatory requirements.
Establish Data Ownership
Another important element of data engineering is establishing data ownership. Data ownership involves assigning responsibility for the quality, security, and privacy of data within an organization. By clearly defining data ownership, you can ensure that the right people are accountable for managing and maintaining data assets. This helps prevent data silos, promote data quality, and facilitate collaboration across different teams.
Master SQL Queries
Structured Query Language (SQL) is a fundamental tool for data engineers and analysts alike. SQL allows you to retrieve, manipulate, and analyze data stored in relational databases efficiently. To optimize your data engineering processes, it’s essential to master SQL queries. By writing efficient and optimized SQL queries, you can extract insights from data quickly and accurately. Practice writing complex queries, optimizing performance, and leveraging advanced SQL functions to enhance your data analysis capabilities.
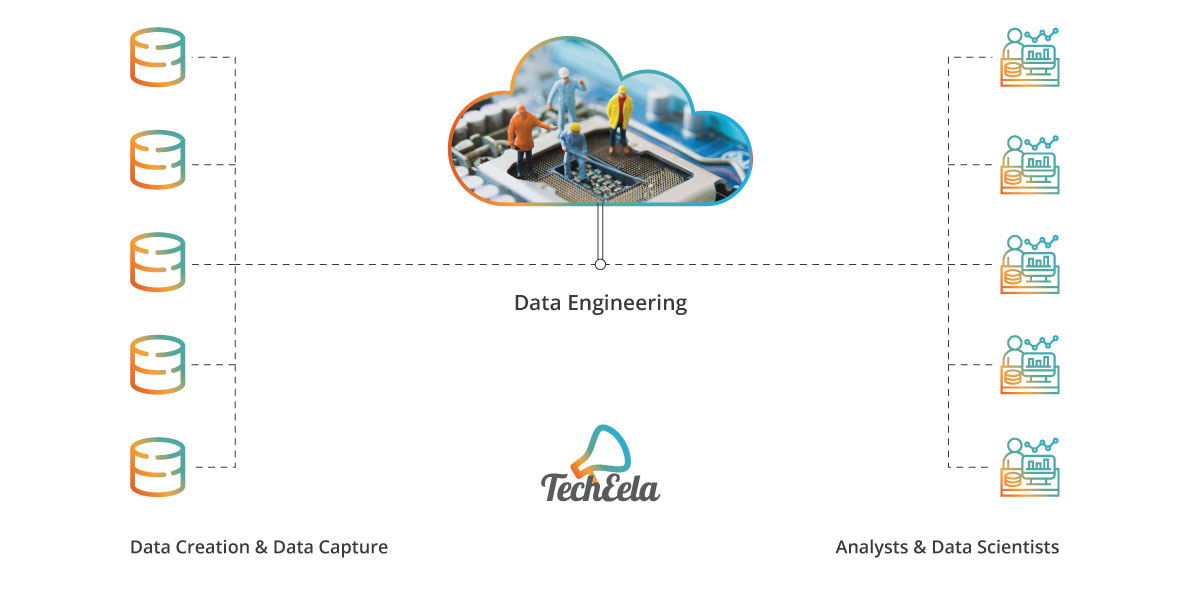
Image courtesy of via Google Images
Excel for Data Analysis
Excel is a versatile tool that many data analysts are familiar with. While Excel may not be as robust as specialized data analytics platforms, it can still be a powerful tool for data analysis. Excel offers a range of functions and features that allow you to perform basic data manipulation, visualization, and analysis. To optimize your data engineering processes, familiarize yourself with Excel functions, pivot tables, and charts. Excel can serve as a handy tool for small-scale data analysis projects or quick exploratory data analysis.
Harness the Power of Python
Python has emerged as a popular programming language for data engineering and analysis. With its rich ecosystem of libraries and frameworks, Python allows data analysts to perform advanced data manipulation, statistical analysis, and machine learning tasks. To optimize your data engineering processes, learn how to harness the power of Python. Explore libraries such as Pandas, NumPy, and Matplotlib for data manipulation, analysis, and visualization. Python’s flexibility and scalability make it an invaluable tool for handling large datasets and complex data analysis tasks.

Image courtesy of via Google Images
Utilize R for Statistical Analysis
R is another versatile programming language commonly used for statistical analysis and data visualization. With its powerful packages and functions, R is a favorite among data analysts for conducting in-depth statistical analysis and producing high-quality visualizations. To optimize your data engineering processes, consider incorporating R into your analytical toolkit. Explore packages like ggplot2 for data visualization, dplyr for data manipulation, and caret for machine learning. R’s strong statistical capabilities make it an excellent choice for teachers transitioning into data analytics roles.
Visualize Data with Tableau
Data visualization plays a crucial role in data analysis, allowing you to communicate insights and findings effectively. Tableau is a popular data visualization tool that enables you to create interactive dashboards and visualizations from various data sources. To optimize your data engineering processes, familiarize yourself with Tableau’s features and functionalities. Learn how to connect data sources, create impactful visualizations, and build intuitive dashboards. Tableau’s user-friendly interface and powerful visualization capabilities make it a valuable asset for data analysts seeking to enhance their data visualization skills.
Image courtesy of via Google Images
Analyze Data with PowerBI
Microsoft Power BI is another leading business intelligence tool that offers powerful data analysis and visualization capabilities. Power BI enables you to connect to different data sources, create interactive reports, and share insights with stakeholders. To optimize your data engineering processes, explore Power BI’s features and capabilities. Learn how to create data models, design compelling reports, and share insights with your audience. Power BI’s integration with other Microsoft products and services makes it a versatile tool for teachers transitioning into data analytics roles.
Conclusion
Congratulations on completing this beginner’s guide to data engineering for analytics! By following the 10 essential tips outlined in this guide, you can optimize your data engineering processes and enhance your data analysis capabilities. Whether you’re tracking data lineage, mastering SQL queries, or visualizing data with Tableau, each tip plays a crucial role in streamlining your data analysis workflows. As you continue to explore the vast world of data engineering and analytics, remember to apply these tips and techniques to drive better insights and decision-making within your organization.