

Unlock the power of data transformation with our guide on seamlessly transitioning from spreadsheets to Structured Query Language (SQL).

Table of Contents
- Understanding the Basics of SQL
- Setting Up Your SQL Environment
- Importing Data from Excel to SQL
- Data Manipulation and Filtering in SQL
- Joining Tables in SQL
- Creating Views and Stored Procedures
- Aggregating Data in SQL
- Writing Complex Queries in SQL
- Data Visualization and Reporting
- Best Practices and Resources for Learning SQL
- Conclusion
Hey there, teachers turned data analysts! Are you ready to level up your data analysis game? If you’ve been relying on Excel spreadsheets to manage and analyze data, it’s time to take the leap to SQL (Structured Query Language) for more efficient and powerful data manipulation. In this blog post, we’ll walk you through the essential tips and tricks to help you smoothly transition from Excel to SQL and boost your data analysis skills.
Understanding the Basics of SQL
Let’s start by demystifying SQL. SQL is a programming language used for managing and manipulating structured data in databases. Unlike Excel, which is a spreadsheet program, SQL allows you to interact with large datasets more efficiently through querying and manipulating data using specific commands. Common SQL commands include SELECT, INSERT, UPDATE, DELETE, and more.
Setting Up Your SQL Environment
Before diving into SQL, you’ll need to set up your environment. You can either install a SQL server on your computer or use online SQL platforms for practice. Connecting to databases and querying data may seem daunting at first, but once you get the hang of it, you’ll find it much more intuitive than working with spreadsheets.
Importing Data from Excel to SQL
One of the first steps in transitioning from Excel to SQL is importing your data. To do this, you need to convert your Excel spreadsheets into SQL tables. Make sure to format your data correctly in Excel before importing it into a SQL database to avoid any issues. This process will allow you to work with your existing datasets in SQL for more advanced analysis.

Image courtesy of via Google Images
Data Manipulation and Filtering in SQL
In SQL, data manipulation and filtering are done through specific commands like WHERE, ORDER BY, and GROUP BY. These commands allow you to filter, sort, and summarize data based on your specific requirements. By mastering these commands, you’ll be able to quickly retrieve the information you need from large datasets.
Joining Tables in SQL
One of the powerful features of SQL is the ability to join multiple tables to retrieve related data. There are different types of joins, such as INNER JOIN, LEFT JOIN, and RIGHT JOIN, each serving a specific purpose. By understanding how to join tables in SQL, you can combine data from multiple sources for more comprehensive analysis.

Image courtesy of via Google Images
Creating Views and Stored Procedures
Views and stored procedures are valuable tools in SQL for simplifying complex data manipulation tasks. Views allow you to create virtual tables based on SQL queries, while stored procedures are pre-compiled SQL statements stored in the database for repeated use. By utilizing views and stored procedures, you can streamline your data analysis workflow and improve efficiency.
Aggregating Data in SQL
Aggregating data in SQL involves using functions like SUM, AVG, COUNT, and others to perform calculations on groups of data. These aggregate functions are helpful for summarizing and analyzing large datasets, providing insights into the overall trends and patterns within the data. By mastering aggregate functions, you can extract valuable information from your datasets.
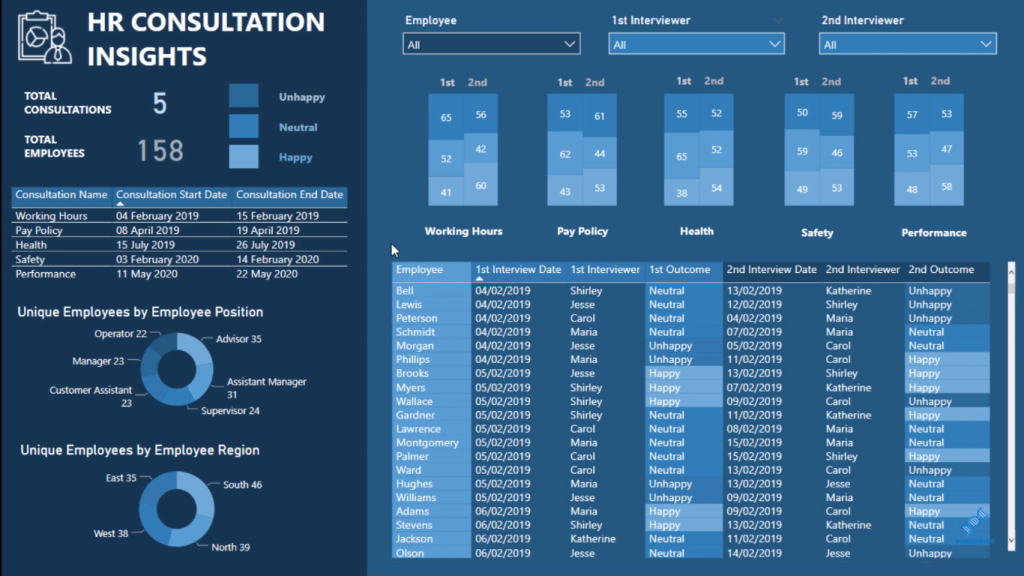
Image courtesy of via Google Images
Writing Complex Queries in SQL
As you progress in your SQL journey, you’ll encounter the need to write complex queries to solve specific data analysis problems. Nested queries and subqueries are essential tools for handling complex SQL queries efficiently. By honing your skills in writing complex queries, you’ll be able to tackle challenging data analysis tasks with confidence.
Data Visualization and Reporting
Once you’ve gathered and analyzed your data in SQL, the next step is visualizing and reporting your findings. There are various tools and techniques available for data visualization, such as Excel, Tableau, or Power BI. You can export your SQL query results to these tools to create interactive visualizations and reports for better communication of insights.

Image courtesy of via Google Images
Best Practices and Resources for Learning SQL
Learning SQL is an ongoing process, and there are plenty of resources available to help you improve your skills. Online tutorials, courses, and communities can provide support and guidance as you continue your SQL learning journey. By dedicating time to practice and explore new SQL techniques, you’ll become a proficient data analyst in no time.
Conclusion
Transitioning from Excel to SQL may seem challenging at first, but with dedication and practice, you can master the art of data analysis in SQL. By following the tips and tricks outlined in this post, you’ll be well on your way to becoming a data analysis expert. Remember, the journey to mastering SQL is a rewarding one, so keep exploring and pushing your boundaries to unlock the full potential of your data analysis skills.
Stay curious, stay motivated, and happy querying!
Generated by Texta.ai Blog Automation