
Discover the hidden potential of Excel with these advanced tricks and formulas that will revolutionize the way you work.

Table of Contents
Welcome, teachers on the path to becoming data analysts! In this blog post, we will delve into the world of Excel and uncover advanced tricks and formulas that will enhance your data analysis capabilities. Excel is a powerful tool that can streamline your workflow and provide invaluable insights from your data. Let’s explore how to harness the full potential of Excel for your data analysis needs!
Understanding the Basics
Before diving into advanced tricks, it’s essential to have a solid understanding of the basics of Excel. Familiarize yourself with the Excel interface, including the ribbon menu, formulas bar, and worksheet tabs. Learn common terminology such as cells, rows, columns, and sheets to navigate Excel efficiently.
Keyboard Shortcuts
Mastering keyboard shortcuts can significantly improve your productivity in Excel. Instead of clicking through menus, learn time-saving shortcuts such as Ctrl + C to copy, Ctrl + V to paste, or Ctrl + Z to undo. Customize shortcuts to suit your workflow and save precious time during your data analysis tasks.
Formulas and Functions
Formulas and functions are the backbone of Excel’s data analysis capabilities. Start by mastering basic formulas like SUM, AVERAGE, and COUNT to perform essential calculations. As you become more comfortable, explore advanced functions such as VLOOKUP, IF, and INDEX-MATCH to manipulate and analyze your data more effectively.
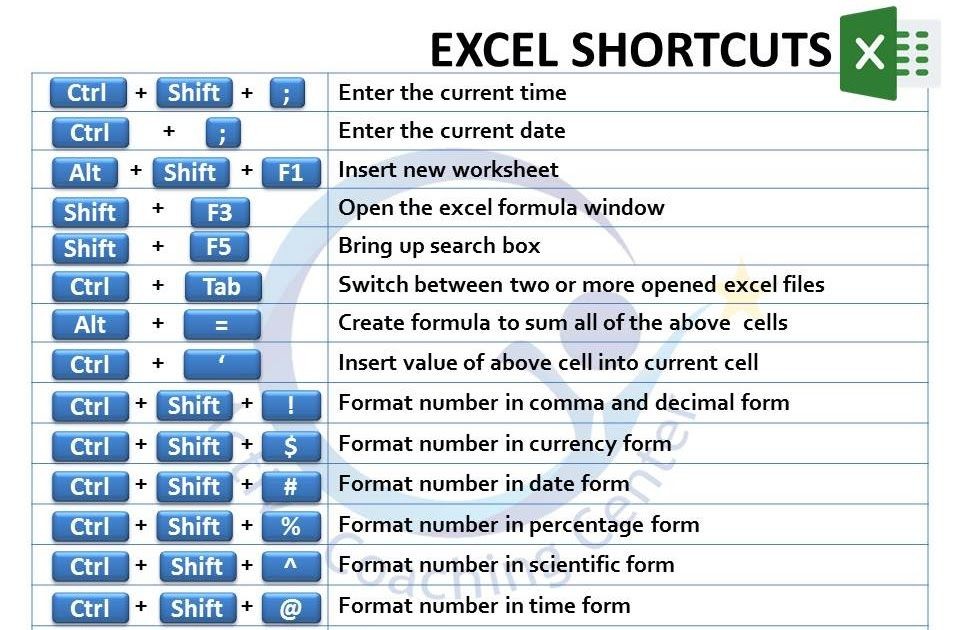
Image courtesy of www.linkedin.com via Google Images
Data Cleaning and Validation
Importing and cleaning data is a crucial step in the data analysis process. Learn how to import data into Excel from various sources and use tools like Text-to-Columns to split data into separate cells. Validate your data for accuracy and consistency to ensure reliable analysis results.
Data Visualization
Data visualization is key to presenting insights in a clear and compelling way. Excel offers a range of chart types and customization options to create visually appealing charts and graphs. Experiment with different chart styles and colors to effectively communicate your data findings.
Image courtesy of www.xlintelligence.co.uk via Google Images
Pivot Tables
Pivot tables are a powerful feature in Excel that allows you to summarize and analyze large datasets quickly. Learn the basics of creating pivot tables and customizing them to display the specific insights you need. Pivot tables can help you uncover patterns and trends in your data with ease.
Data Analysis Tools
Excel has a variety of add-ins that can enhance your data analysis capabilities. Explore tools like Power Query for data transformation and Power Pivot for more advanced data modeling. Integrate Excel with other data analysis tools to streamline your workflow and access additional functionality.
Image courtesy of estoreera.gumroad.com via Google Images
Tips and Tricks for Efficiency
Organizing your data efficiently is essential for effective analysis. Use features like sorting, filtering, and conditional formatting to manage your data effectively. Consider automating repetitive tasks with macros to save time and minimize errors in your data analysis process.
Conclusion
Congratulations, teachers-turned-data analysts, on unlocking the power of Excel! By mastering these advanced tricks and formulas, you are well-equipped to tackle your data analysis tasks with confidence. Continuously expand your Excel skills and explore new features to stay ahead in the ever-evolving world of data analysis. Happy analyzing!